Forex Basics Analysis
Forex Basics Technical Analysis has two factors :
Technical factors:
Some people argue that the exchange rate was not influenced by fundamental factors, but rather is a pattern of repetition from time to time, so the actual direction of these changes can be predicted by using the data – data that has been past.
Psychological Factors :
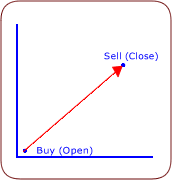
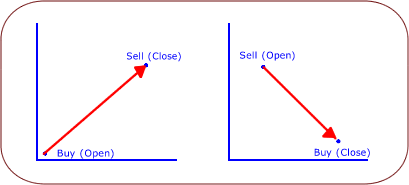
Requests or offers of market participants based on estimates/expectations about future developments in the exchange rate by buying a currency when rates are low and likely to sell after the currency exchange rate rose or vice versa to benefit from these transactions (investments/speculation)
Currency Trading Mechanism :
Factors that influence Technical Analysis:
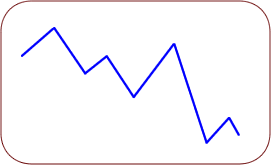
• Charts Patterns (Line Charts and Bar Charts)
• Candlesticks Basic Patterns (Continue and Reversal Pattern)
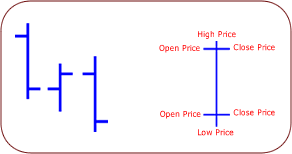

Candlestick Pattern :
MAROBOZU

Marobozu: Candlestick is no shadow.
In general, the longer the candle body is stronger the pressure to sell or buy. Conversely, the smaller the body of the candle weaker the selling pressure or purchase.
The white candle is great to give a bullish signal. Red Candle to give a bearish signal is large. But the candle is too large, resulting in selling or purchasing action being too aggressive may result in the stall.
DOJI

Doji: candlestick that has a very short body even closer to the line shape, with a long shadow over or under range.
Except in a candlestick formation, by itself Doji does not give any meaning in the direction of price movement.
LONG WHITE CANDLE

Long White Candle price shown is in a bullish (rising) . This candle is due to significant price increases because of aggressive buying.
SPINNING TOP WHITE CANDLE

Spinning Top Candle White Candle Stick with a thin body and shadow on the bottom of the same length. This shows the buying and selling activity in balance during the trading session, but prices closed with a thin change from the opening price.
When the time of the downtrend then the show began weakening the momentum of falling prices. This means there is a possibility that prices will move in the opposite direction the next day.
DRAGON FLY DOJI

Dragon Fly Doji: indicates the possibility that prices will move higher in the next day.
Occur if the opening price is equal to the closing price, and they do not differ much from the highest price.
HAMMER

Hammer: a form of white candle with a long lower shadow and the shadow of a small or nonexistent. Hammer shows bullish conditions if it occurs after a significant downtrend.
Occurred because the price was depressed in early trading but rebounded and eventually closed higher than its opening price.
INVERTED HANGING MAN

Inverted Hanging Man or Shooting Star: is a form of black candle with a long upper shadow and the shadow under a small or nonexistent.
Inverted Hanging Man shows bullish conditions if it occurs after a significant downtrend.
An inverted Hanging Man occurs after a price spike followed by a price correction but ultimately fails to close above the opening price, thus formed is the black candle.
MORNING STAR

Morning Star: This pattern indicates that there would be bullish conditions, where the rods are small (star), indicating a reversal and the white stem confirms it.
BULLISH ENGULFING LINE

Bullish Engulfing Lines. This pattern indicates a strong bullish if the occurrence after a significant downtrend.
Trend Indicator ( Trend Line and Moving Average ) :
1. Minor Trend
2. Intermediate Trend
3. Major Trend
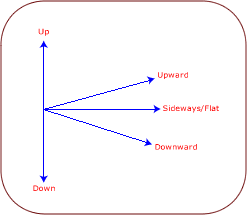
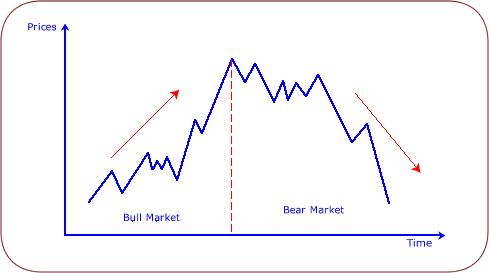
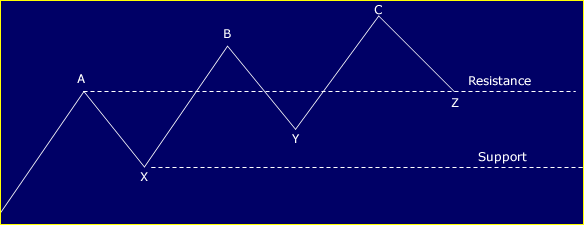
Trend UP / Bullish
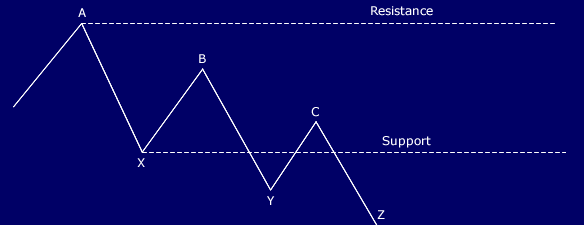
Trend Down / Bearish
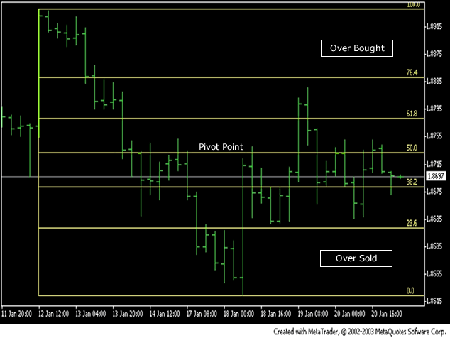
Support, Resistance Indicator ( Trend Line and Fibonacci )
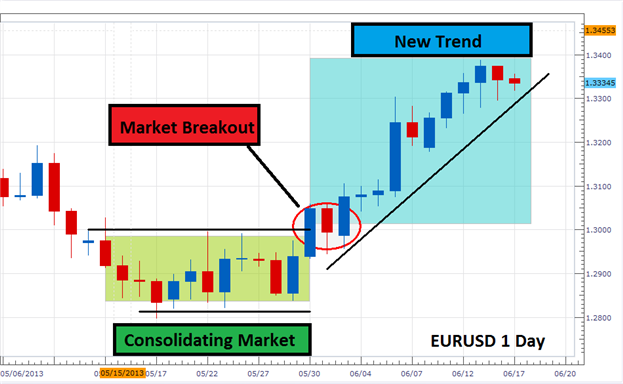
Support level
Is a price level where demand is enough to stop the downward price movements. Thus the price at this level tends to go up.
Resistance level
is a price level where supply is enough to stop the upward price movement. Therefore at this level, the price tended to move down.
Support, Resistance Indicator
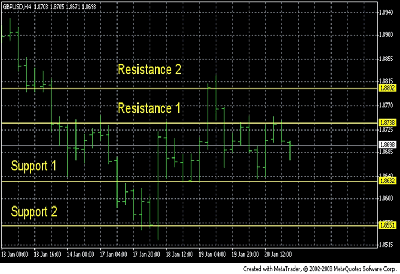
Trend Line and Fibonacci Retracement
(Overbought, Oversold, Pivot point)

Pattern Recognition :
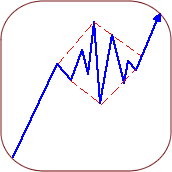
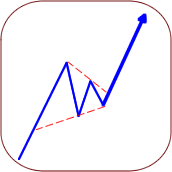
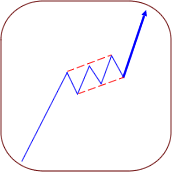
* Continuation Patterns Flag, Diamond, Triangle, Rectangle
* Reversal Patterns Head and Shoulders, Double/ triple top and bottom
Continuation Patterns
Reversal Patterns
Head and Shoulders Top
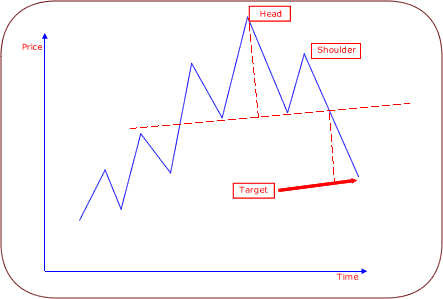
Head and Shoulders Bottom
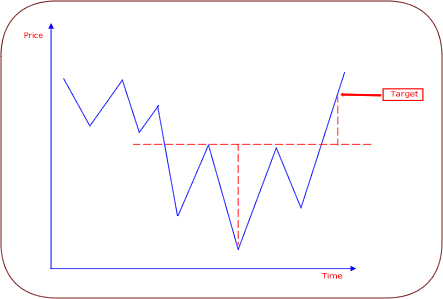
Double Top and Bottom
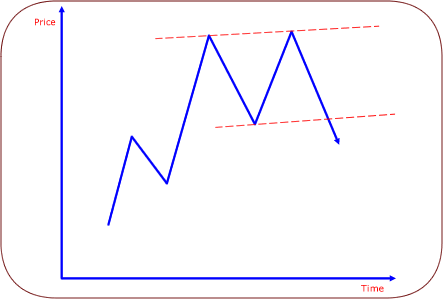
Triple Top and Bottom
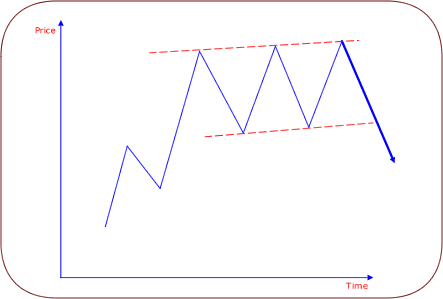
Practice More Perfect Right? Here are my recommendations for trade with the forex market for beginners. Besides basics concept valid price action signals and support resistance trading strategy are still necessary to understand.
Attention
I hope the candlestick forex basics above can be implemented in our trading activity and remember to trade forex with the best strategy and one of the best forex brokers below.
