Currency Market Tend To Follow Support And Resistance Levels, Use Those Levels To Identify Entry And Exits And Apply Risk Management

As we know forex trading is complicated if we don’t exercise and we don’t know what exactly the price from support and resistance levels will reverse to get the best momentum before entry or open position, lines of resistance and support are the basis of the classical trend analysis. Support and resistance levels are price levels where a stock often reverses, indicating a potential change in trend. Support is the price level at which demand is thought to be strong enough to prevent the price from declining further, while resistance is the price level at which selling is thought to be strong enough to prevent the price from rising further. All the trend lines (channels), graphical models reversal, and continuation of trends – this is only a combination of resistance and support lines. so trading with technical analysis one of the keys to making longer-term profits is being able to use support and resistance to make profits.
Most traders fail to trade with support resistance levels correctly so here are some tips using indicators or we can manually check those support resistance levels with our eyes.
Drawing Support Resistance Levels
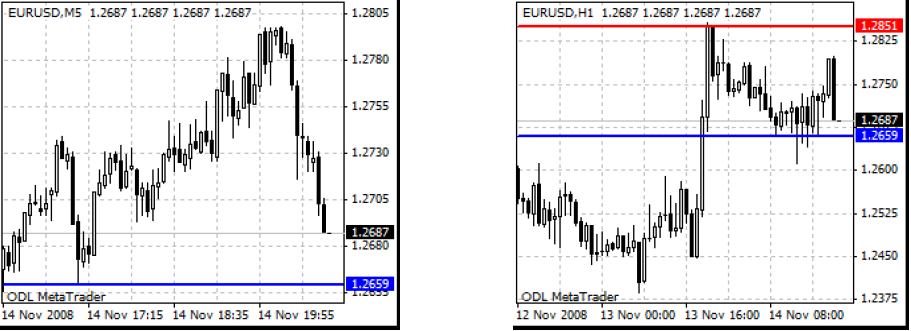
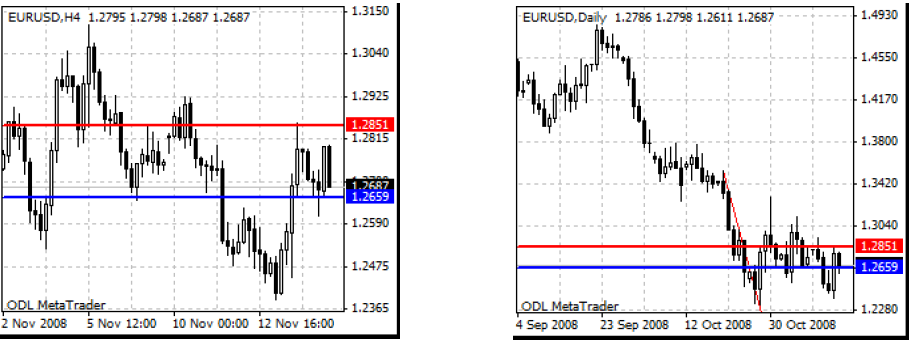
According to the picture above we can see high and low only from the high wick or low wick, the tips for drawing a horizontal line of the support resistance level is by looking left from the current price, and find which one price has been retested at least three times or more and on those level we will found it rejected support or resistance itself, and more accurate at least we checked this support resistance levels on the one-hour time frame and four-hour time frame. More bigger time frame for checking support resistance levels and stronger s/r levels.
The Only Support & Resistance Trading Strategy You Will Ever Need
Techniques for Identifying Strong Support and Resistance Levels Using Candlestick Patterns
- Look for candlestick patterns such as doji, hammer, and shooting stars around support and resistance levels. For example, a Doji at a support or resistance level may indicate a potential reversal.
Utilizing Trendlines and Moving Averages to Confirm Support and Resistance Levels
-
- Draw trendlines connecting the lower highs in a downtrend for resistance and the higher lows in an uptrend for support. The bigger the time frame (H4-D1) used in drawing the trendline as support resistance, the stronger the support resistance area. Based on experience, the support resistance area that has not been breaking out by the close body candle value cannot yet be said to be a breakout. This means that a support resistance level valid break-out when a closing price is above the resistance or below the support level. Here a tips to avoid false breakouts by using a trendline breakout strategy.
- Use moving averages (MAs) to identify dynamic support and resistance levels. For example, the 50-period exponential moving average (EMA) can act as dynamic support or resistance.
Here again some examples from my support resistance charts :
The golden forex strategy that works in every market condition and is very good for day traders is a strong support resistance zone so we can wait and enter on trading price action confirmation signal on a smaller time frame for sure.
Support and resistance levels do not appear by some mathematical formulas, those lines show the attitude of the trader towards the market changes. The bigger the shift in outlook to the market by the majority of the traders, the more important those lines become. The market always has a point, where the market starts changing its direction. If the market was going down and suddenly the price started to climb up, the point where the market turned around would be known as a support. And the opposite: the point where the market, after going up, suddenly starts falling, that turnaround point will be known as resistance. So we can say that at those points traders have changed their opinion about the current situation and decided to go the other way.
The easy way to find at least accurate support and resistance levels is using with indicator, my favorite indicator is Murray Math and support resistance levels that I’ve got from Forex factory, you can use it on m30,h1, or even h4, daily trader using it on combination h1 and h4 time frame. Use this support resistance level during trading at least two-time frames of your currency pair so we can find zone entry levels.
Open order better when you get a signal or have found any factor, or (in your forex trading strategies) on at least two time frames! The golden rule of the bankers is – let me take less profit, but reliable every day!
You can see the picture below :
Conclusion
Whatever fundamental reasons are, or maybe there is no reason at all, traders already started selling or buying. And those lines will let us know about those changes. With some fine-tuning, the method of drawing support and resistance can be utilized by traders as a comprehensive trading model for the forex market. As a full-time forex trader, we should understand how market structure happens and what is liquidity area too.
Always practice practice, and practice to get steady trading skills using support resistance levels as our entry levels. Download and learn about great trading with support resistance levels here and we hope we all as a trader can be wise in using this support resistance trading technique as our based analysis and combine this based strategy with candlestick basics analysis and basic stop loss strategy to get more secure.