Trade With Ichimoku Kinko Hyo
Ichimoku Kinko Hyo (IKH) is an indicator that gauges future price momentum and determines future areas of support and resistance. Now that’s 3-in-1 for y’all! Also, know that this indicator is mainly used on JPY pairs.
To add to your Japanese vocab, the word Ichimoku translates to “a glance”, Kinko means “equilibrium”, while hyo is Japanese for “chart.” Putting that all together, the phrase ichimoku kinko hyo stands for “a glance at a chart in equilibrium.” Huh, what does all that mean?
A chart might make things easier to explain…
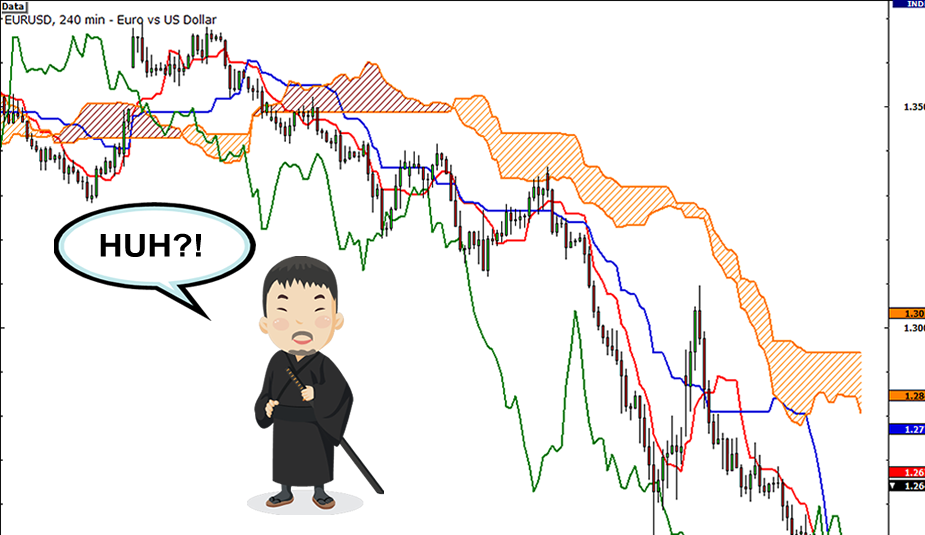
Whoops. That didn’t help. A few more lines and this will resemble a seismograph.
Ichimoku Kinko Hyo Components Details
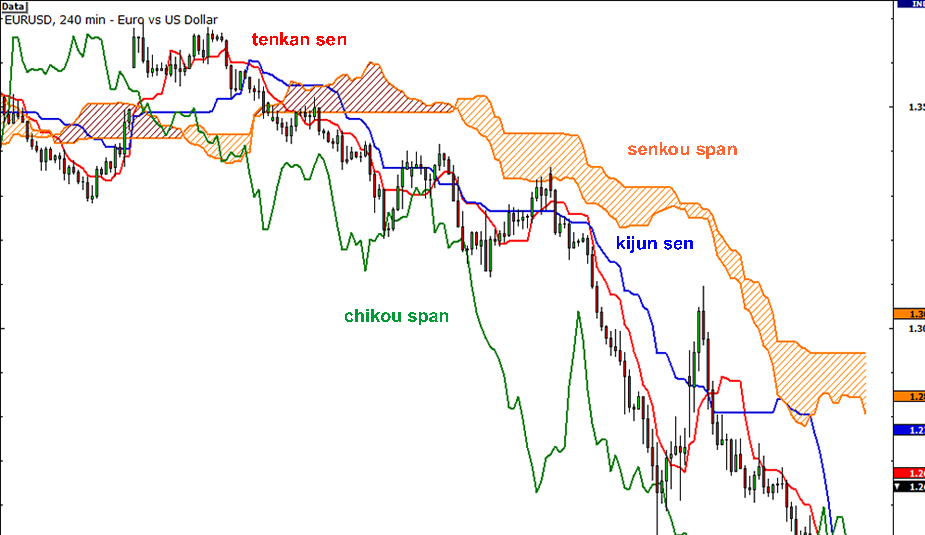
Before you go off and call this gibberish, let’s try to find out what each of the lines is for.
Kijun Sen (blue line): Also called standard line or baseline, this is calculated by averaging the highest high and the lowest low for the past 26 periods.
Tenkan Sen (red line): This is also known as the turning line and is derived by averaging the highest high and the lowest low for the past nine periods.
Chikou Span (green line): This is called the lagging line. It is today’s closing price plotted 26 periods behind.
Senkou Span (orange lines): The first Senkou line is calculated by averaging the Tenkan Sen and the Kijun Sen and plotting 26 periods ahead. The second Senkou line is determined by averaging the highest high and the lowest low for the past 52 periods and plotting 26 periods ahead.
Got it? Well, it’s not really necessary for you to memorize how each of the lines is computed. What’s more important is for you to know how to interpret these fancy lines.
How to Trade Using Ichimoku Kinyo Hyo Indicator
Let’s take a look at the Senkou span first.
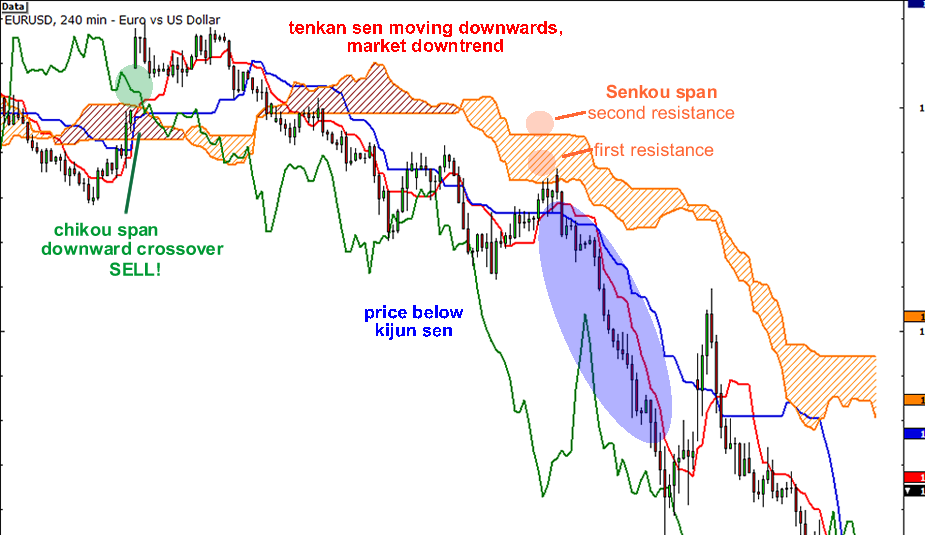
If the price is above the Senkou span, the top line serves as the first support level while the bottom line serves as the second support level.
If the price is below the Senkou span, the bottom line forms the first resistance level while the top line is the second resistance level. Got it?
Meanwhile, the Kijun Sen acts as an indicator of future price movement. If the price is higher than the blue line, it could continue to climb higher. If the price is below the blue line, it could keep dropping.
The Tenkan Sen is an indicator of the market trend. If the red line is moving up or down, it indicates that the market is trending. If it moves horizontally, it signals that the market is ranging.
Lastly, if the Chikou Span or the green line crosses the price in the bottom-up direction, that’s a buy signal. If the green line crosses the price from the top down, that’s a sell signal.
Here’s that line-filled chart once more, this time with the trade signals:
It sure looks complicated at first but this baby’s got support and resistance levels, crossovers, oscillators, and trend indicators all in one go! Amazing, right?
To understand the Ichimoku forex trading strategy easily, here are the basics trading forex strategy using Ichimoku trading indicators explanation in advance.
Okay, we’ve already covered a smorgasbord of indicators. Let’s see how we can put all of what you just learned together…