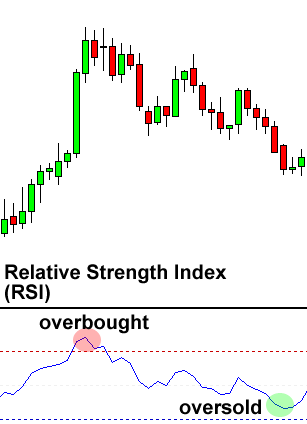
Relative strength index, or RSI, is similar to the stochastic in that it identifies overbought and oversold conditions in the market. It is also scaled from 0 to 100. Typically, readings below 30 indicate oversold, while readings over 70 indicate overbought. We can use level 20 as an oversold and level 80 as an overbought filter. The best time frame used on H1-H4 for intraday traders. If the trader has patience, this low-risk trading strategy is very good and works well in any market conditions.
How to Trade Using RSI
RSI can be used just like the stochastic. We can use it to pick potential tops and bottoms depending on whether the market is overbought or oversold. The simplest use of the RSI indicator is to look at the level of the RSI line against the level 30 and level 70 lines.
Below is a 4-hour chart of EUR/USD.
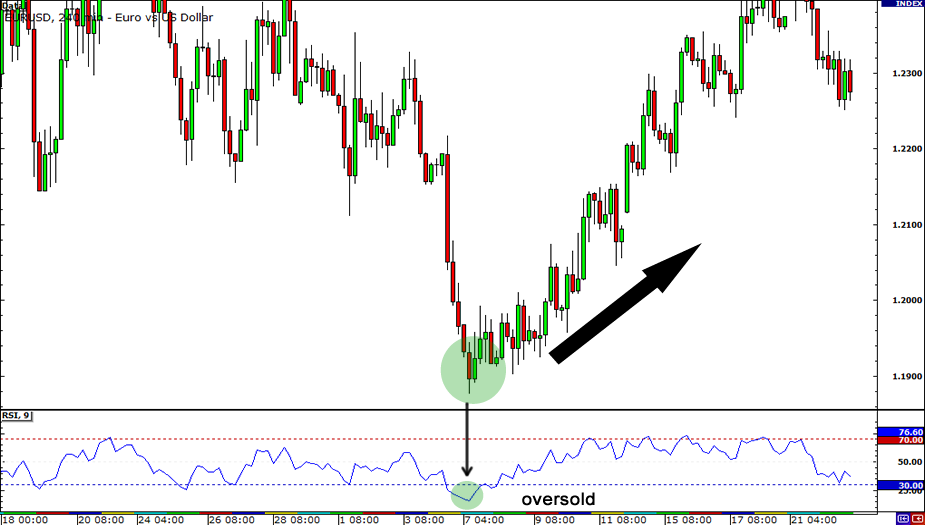
EUR/USD had been dropping the week, falling about 400 pips for two weeks.
On June 7, it was already trading below the 1.2000 handle. However, the RSI dropped below 30, signaling that there might be no more sellers left in the market and that the move could be over. Price then reversed and headed back up over the next couple of weeks.
Determining the Trend using RSI
RSI is a very popular tool because it is usually used as a momentum for faster trading signals. These Low-Risk SCALPING With “BOLLINGER BANDS & RSI TRENDLINE BREAKS” will give us when the prevailing trend has ended and a new trend is underway. If you think a trend is forming, take a quick look at the RSI and look at whether it is above or below 50.
If you are looking at a possible uptrend, then make sure the RSI is above 50. If you are looking at a possible downtrend, then make sure the RSI is below 50.
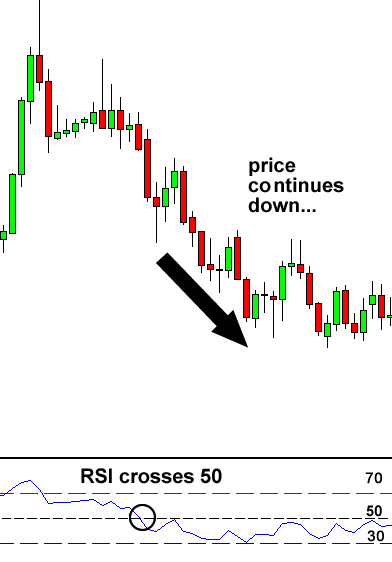
At the beginning of the chart above, we can see that a possible downtrend was forming. To avoid fakeouts, we can wait for the relative strength index to cross below 50 to confirm our trend. Sure enough, as the relative strength index passes below 50, it is a good confirmation from the relative strength index that a downtrend has formed. Lastly don’t forget this overbought oversold trading strategy is very suitable for scalping in 5 minutes – to 15-minute time frame, intraday trading strategy starts with 30 minutes and a 1-hour time frame, swings on 4 hours until a daily time frame or even position trading style with weekly or monthly time frame, so this RSI trading system is good enough for scalpers until swing traders which very easy for new traders…
But, we adding Bollinger bands and waiting for trendline breakout on RSI overbought oversold areas for the confirmation signals. Learn and understand using this full tutorial below, and apply this trading concept in multiple time frame analyses. Swing forex traders use it on a daily to read the current major trend remaining, whether is it an uptrend or a downtrend. and wait for trading signals confirmation with the best momentum entry in 1-hour or four-hour time frame with the same method.