Fibonacci numbers were developed by Leonardo Fibonacci and it is simply a series of numbers that when you add the previous two numbers you come up with the next number in the sequence. Here is an example:
1, 2, 3, 5, 8, 13, 21, 34, 55
See how when you add 1 and 2 you get 3? Now add 2 and 3 and you get 5, and so on. So how does this sequence help you as a swing trader?
Well, the relationship between these numbers is what gives us the common Fibonacci retracement pattern in technical analysis.
While there are many variations of the ratio set, simple is better, let’s focus on four major retracement levels.
23.6% — The shallowest of the retracements. In very strong trending markets price typically quickly bounces in the area of this ratio.
38.2% — This is the first line of defense of the current trend. Breaking this level starts to erode the underlying trend.
50% — The neutral point of any retracement. This is the critical tipping point.
61.8% — retracing to this typically signals a breakdown in the trend.
100% — Matching the move
In this section, we will also show examples of how potential opportunities form when price retraces beyond 100% by following another set of Fibonacci ratios:
138.2%
161.8%
200%
Notice in each case we have simply added 100% to the standard ratio set. I use this set of retracements on a daily basis, from 23.6% all the way to 200% and sometimes 300% For my style of trading I find 38.2%, 50%, and 61.8% quite reliable. I use the other primarily as confirmation levels.
The first thing you have to know about the Fibonacci tool is that it works best when the market is trending. Need to know that Fibonacci has 4 variants that are Fibonacci retracement, Arc, Fan, and Expansion. Fibonacci retracement is often used by traders in general than other types of Fibonacci, I will begin to share Fibonacci retracement first.
The idea is to go long (or buy) on a retracement at a Fibonacci support level when the market is trending up, and to go short (or sell) on a retracement at a Fibonacci resistance level when the market is trending down.
In order to find these retracement levels, you have to find the recent significant Swing Highs and swing lows. Then, for downtrends, click on the Swing High and drag the cursor to the most recent Swing Low.
For up-trends, do the opposite. Click on the Swing Low and drag the cursor to the most recent Swing High.
Got that? Now, let’s take a look at some examples of how to apply Fibonacci retracement levels in the markets.
Uptrend
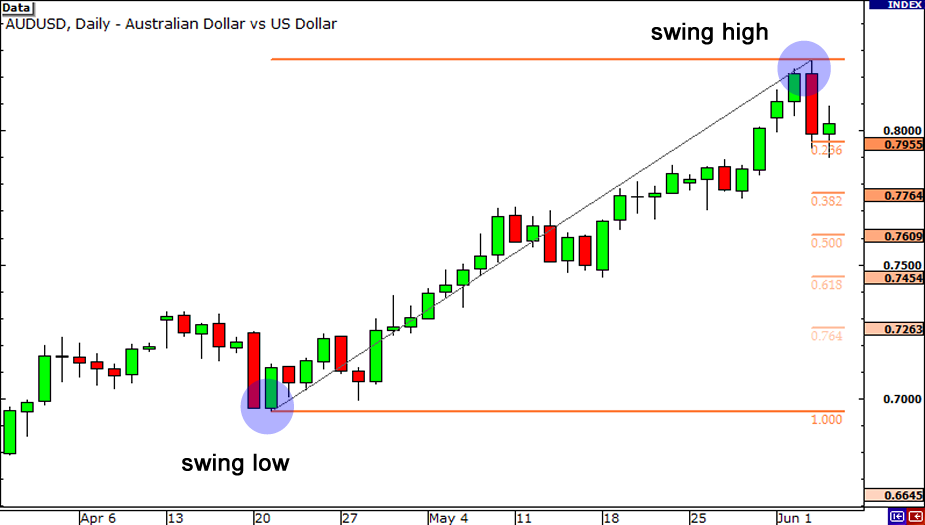
This is a daily chart of AUD/USD.

Here we plotted the Fibonacci retracement Levels by clicking on the Swing Low at .6955 on April 20 and dragging the cursor to the Swing High at .8264 on June 3. Tada! The software magically shows you the retracement levels.
As you can see from the chart, the retracement levels were .7955 (23.6%), .7764 (38.2%), .7609 (50.0%), .7454 (61.8%), and .7263 (76.4%).
Now, the expectation is that if AUD/USD retraces from the recent high, it will find support at one of those Fibonacci levels because traders will be placing buy orders at these levels as the price pulls back.
Now, let’s look at what happened after the Swing High occurred.

Price pulled back right through the 23.6% level and continued to shoot down over the next couple of weeks. It even tested the 38.2% level but was unable to close below it.
Later on, around July 14, the market resumed its upward move and eventually broke through the swing high. Clearly, buying at the 38.2% Fibonacci level would have been a profitable long-term trade!
Downtrend
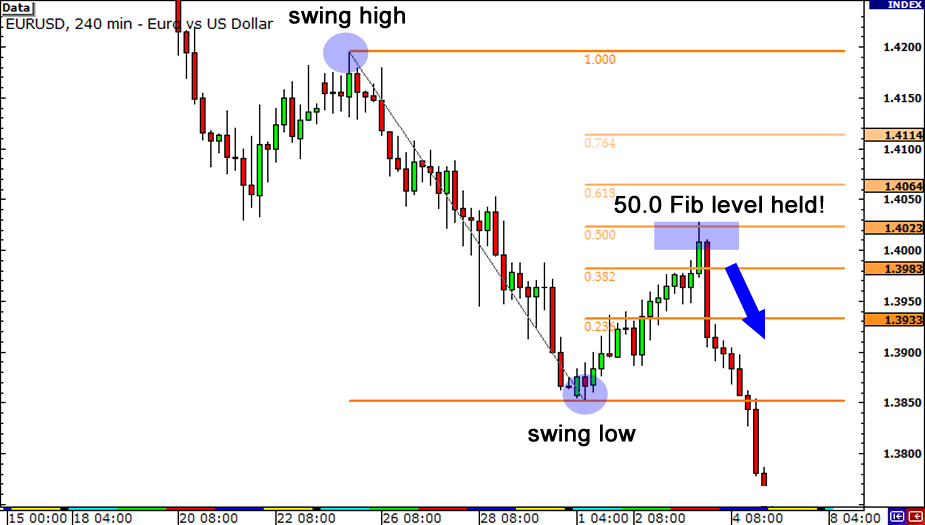
Now, let’s see how we would use the Fibonacci retracement tool during a downtrend. Below is a 4-hour chart of EUR/USD.

As you can see, we found our Swing High at 1.4195 on January 26 and our Swing Low at 1.3854 a few days later on February 2. The retracement levels are 1.3933 (23.6%), 1.3983 (38.2%), 1.4023 (50.0%), 1.4064 (61.8%) and 1.4114 (76.4%).
The expectation for a downtrend is that if the price retraces from this low, it will encounter resistance at one of the Fibonacci levels because traders will be ready with sell orders there.
Let’s take a look at what happened next.

Bowza, isn’t that a thing of beauty?! 😉
The market did try to rally, stalling below the 38.2% level for a bit before testing the 50.0% level. If you had some orders either at the 38.2% or 50.0% levels, you would’ve made some mad pips on that trade.
In these two examples, we see that the price found some temporary support or resistance at Fibonacci retracement levels. Because of all the people who use the Fibonacci tool, those levels become self-fulfilling support and resistance levels.
One thing you should take note of is that prices won’t always bounce from these levels. They should be looked at as areas of interest, or as Cyclopip likes to call them, “KILL ZONES!” We’ll teach you more about that later on.
Here are Fibonacci retracement automatic indicators for free. And these Fibonacci retracement trading templates can be used in London sessions.
And learn and practice too about what liquidity sweep is.
And the most basic trading strategy we should understand is how we get trading signals based on price action confirmation breakouts in a big time frame at least H4 time frame.
For now, there’s something you should always remember about using the Fibonacci tool and it’s that they are not always simple to use! If they were that simple, traders would always place their orders at Fib levels and the markets would trend forever.
In the next lesson, we’ll show you what can happen when Fibonacci levels fail.
In determining the points of the Swing High and Swing Low precisely to produce accurate Resistance Support needed from your own experience. The more you use the Fibonacci retracement trading strategy, the more professional you will be. Hope it helps, success always. 😉


