Hi again, these harmonic patterns are so accurate on the h4 time frame and can be used on m1 EURUSD or even any pairs symbol but extremely made high profit on m1 EURUSD but remember for scalpers stay away from the news or fundamental factors which we can adjust timing from forexfactory.com
What Time Frame Using Harmonic Patterns For Better Trading Signals In Accuracy
The butterfly pattern can be used on various timeframes and currency pairs, depending on the trader’s preference and the market conditions. It’s essential to choose a timeframe that aligns with your trading strategy and the butterfly pattern you’re trading.
The AB=CD Patterns
Fibonacci ratios within the structure manifest specific reciprocal relationships.
Retracement point C Projection BC
0.382% .24 or 2.618%
0.50% 2.0%
0.618% 1.618% The perfect alignment ratio
0.707% 1.41%
0.786% 1.27%
0.886% 1.13%
BC projection should converge closely with the completion of the AB=CD leg
This auto Fibonacci indicator may help for a more easy way to read target pricing automatically. Download here Change the Fib period to 30, which is good for intra-day trading.
There have been a lot of questions on how to identify the different harmonic patterns.
Also Read Article :
Identifying the different harmonic patterns
… The way I see them…
Now, I have not come across this kind of classification anywhere & I could be wrong in my conclusions.
But over the number of years that I have been studying the Fibonacci ratios & harmonic patterns, I have observed these subtle differences.
First and foremost, let us understand what a harmonic pattern is. A harmonic pattern is simply –
An impulsive wave (X to A) is followed by two corrective waves (A to B and C to D) which ultimately gives rise to a larger impulsive wave (the price targets).

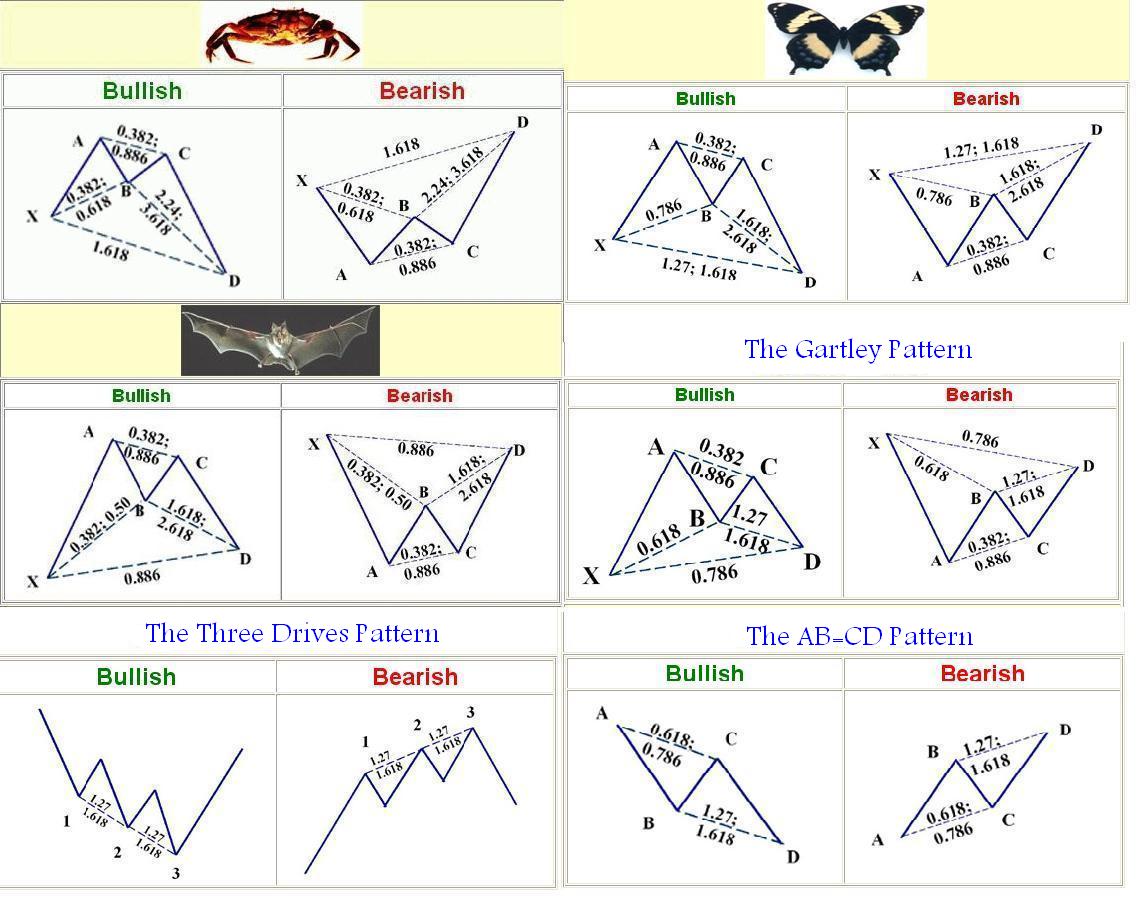
The important points that one should follow are -The retracement of X-A to point B usually identifies the kind of harmonic pattern that should ultimately form.
Point C is generally the weak link in the pattern. The retracement of A-B to point C could form at any fib ratio, right from 0.382 to 0.886.
Point D is the ultimate confirmation point of a harmonic pattern. ‘D’ will always form at a confluence of 2 fib levels (depending on the type of pattern) and these fib levels are very accurate. The 2 fib ratios (the Retracement of X-A AND the Projection of B-C) form precisely at the expected levels.
Let’s have a look at the specifics of the retracement ‘B’ (of the move from X to A) –
The Bat pattern –
In this pattern, the first corrective wave to ‘B’ is a shallow correction, and retraces to 38.2 to 50.0. In that case, the second corrective wave to ‘D’ should form at 0.886 of X-A.
(Note: Most of the time ‘B’ forms at the 38.2 level.)

The Gartley pattern –
In this pattern, the first corrective wave to ‘B’ is a specific correction to 61.8 of X-A. In that case, the second corrective wave to ‘D’ should form at 0.786 of X-A.
(Note: This is a very specific pattern and the two corrective waves will always form at the 61.8 and 78.6 levels precisely.)

The Butterfly Pattern –
In this pattern, the first corrective wave to ‘B’ is a deep correction, and retraces to 78.6 of X-A. In that case, the second corrective wave to ‘D’ should form at 1.272 of X-A.

You will notice that the location of ‘D’ is based on the fib ratios of X-A, and the fib ratios of B-C have not been taken into consideration.
This is because I have observed that the B-C projections may vary from one fib level to another, but the fib ratios of X-A always form at the precise levels.
Also Read Article :
Let us have a look at another harmonic pattern.
The Crab pattern –
This is a pattern that does not occur very frequently, and one can only identify it after the entire 5 wave structure has been completed.
This is because, unlike the previous patterns the first corrective wave to ‘B” is somewhat subjective. In fact, the identifying factor for this pattern is the second corrective wave to ‘D’ which is a very deep wave.
In this pattern, the first corrective wave to ‘B’ could be anywhere from 38.2 to 61.8.
The second corrective wave, subsequently to ‘D’ is a deep wave & should form at 1.618 of X-A.

Finally, some amount of discretion is required, since the price will never behave exactly the way we expect. You can learn more about Fibonacci 21 and candlestick basics to analyze entry-based supply-demand trading strategy ratio level too.
But this classification has given me an edge for the anticipated price moves & I hope it does the same for you. From my experience, I have seen that it is the Gartley & the Butterfly that occur more often & I would concentrate on these 2 patterns, happy identifying these great forex harmonic patterns and combining them with forex support resistance analysis using this The Candlestick Trading Bible E-book to get stable pips all the time.
Try this forex patterns analysis trading strategy in cents account first to practice how good we are at reading these patterns. ROBOFOREX and EXNESS offer this cents forex account with 1:2000 leverage. I hope this article can help identify what kind of harmonic patterns are and how we trade using this harmonic patterns forex trading strategy.