Forex Trend Lines
A forex trader should understand how to make the right forex trend lines, understand the use of trend lines, and so forth.
Books about forex trend lines covering rules, goals, and benefits from the trend line in the forex charts.
The trend line is a guide that helps us to know the direction of prices over a certain period. If the trend line is placed correctly, will provide answers to the:
– At what price we are allowed to enter the forex market (open position),
– Open a position to sell or buy,
– When should come out or are planned to come out (close position)?
Let’s start, first select the chart forex ample. To obtain a major trend in the forex market, traders need to change the time frame for forex charts into a higher time frame.
After the enlarged time frame for the graph, it would seem clear where the market moves, can go up can come down. If still difficult to determine the direction of the forex market is in a state that seems to side way (not clear up or down), traders need to enlarge the longer time frame charts forex.
Here are related to general matters. If you include a group of traders ‘daily’, you should concentrate on the direction of the current price. Traders who opened the position of “minutes”, “hourly”, “daily” or more, need to obtain a wider price movement (“hourly”, “Daily”, “monthly”).
Traders still need to look at the forex chart’s time frame for 1 hour, 30 minutes later time frames, and smaller again for certainty of the direction of the market price.
(Time frame 1-hour mean, new stem candlestick charts added every one hour; in the same way, time frame for 1-minute mean, new stem candlesticks forex trading system charts added every one minute)
Considering the current conditions we see prices are rising and graphs from several different time frames state the same thing. In conditions of rising trend, trend lines we put down under the patterns formed. (In the trend of falling, the trend line we put it on the patterns formed).
There are several important points in the forex charts that helped us to create a trend line forex. We call the points A-B-C-D.
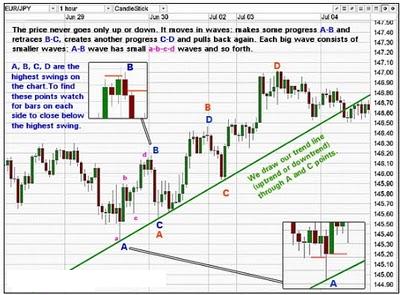
See the image above:
Prices do not just go up or down only, the price moves like a wave of ‘A to B, back from B to C, moving again from C to D, and so on. Each big wave consists of waves of smaller: Waves AB consists of a small wave abcd and so on ‘
‘ABCD is the point of farthest-point swing from the graphs that are available’
‘trend line is made using a point A and point C’
So:
1. Find a graph that is large enough to draw the movement of the forex market situation today.
2. Consider the points ABCD.
3. Create a trend line through the points A and C.
4. The more points A and C and subsequent points touching the trend line are created it will outline the trend will be more accurate.

See the image above:
Point A-B-C-D has occurred.
Point C long to change into the new A, and D long been the new B and beyond.
Draw a trend line through the points A and C
See chart above. Try to find point A-B-C-D forex chart patterns.
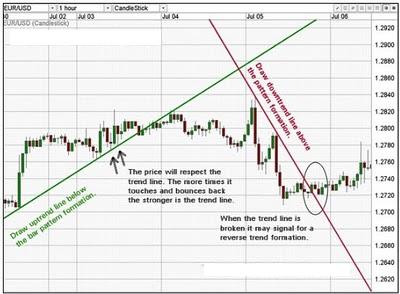
‘Draw the trend line rises below the wave pattern is formed’
‘Prices will follow the trend line. The line where the price touched and bounced back with a strong trend is the line ‘
‘Draw the trend line down on top of the wave pattern is formed’
‘When the trend line was broken (not continuous) it could be a sign of a trend reversal’
We will always pay attention to the trend line which we find to make sure the price keeps moving in the right direction.
A broken trend line tells us about the possibility of reversal.
Deemed to have broken the trend line when the stems are intact next candlestick is formed at the opposite of the trend line. If only through the trend line is not considered broken.
Note:
We will find that every time the trend line should always be drawn more appropriate price movements occur. Perform renewal trend line, but consider the previous trend line (which has been valid for a certain period).

See chart above:
‘trend line the inside (inner)’
‘the main trend line’
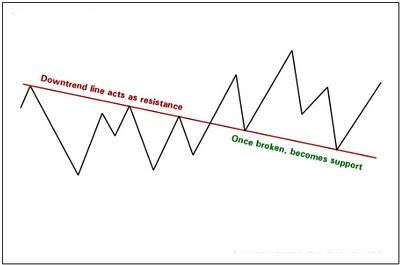
On the downtrend, trend lines act as “resistance”. Prices touched the trend line and bounced off the bottom line and the declining trend continues. If broken, down trend line changes to “support” to ride the new trend. Usually, the price will go back to touch the line “support ” several times before the downtrend line completely changes direction.
Vice versa, the rising trend, trend lines act as “support “. Prices touched the trend line and bounced off the top line and the rising trend continues. If broken, the rising trend line changes to “resistance”.
See the image above:
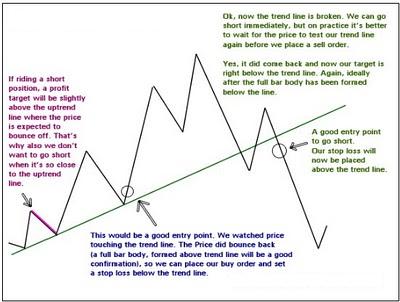
Notice when and where to go (open) or exit (close) from the forex market by using the trend line.
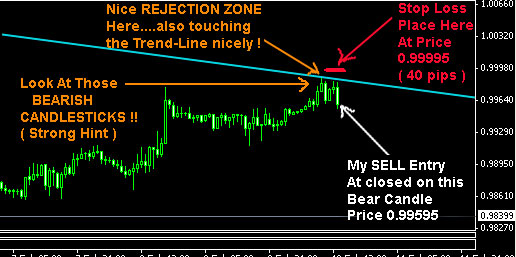
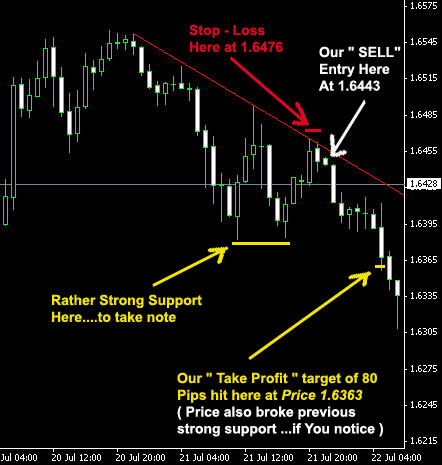
‘If you open a short position (sell), the target profit is placed slightly above the trend line where price rises are expected to bounce back for the ride. That’s why we do not want to open a short position (sell) when prices are too close to the trend line rising ‘
‘The point of this kind should be a good entry point. We have noticed some earlier prices have touched the trend line. Trunk price charts that are now bouncing back (already existing stem price chart as a whole which has been above trend line up is a good way of assurance), in conditions like this we can open a buy position and put a stop loss below the trend line ‘
‘Ok, now the trend has been broken, we can do short (sell) immediately, but it’s better to wait for bar graphs and bounce in the price touched downtrend line that we created before making orders sell’
‘Yes, prices have bounced back, and now our attention is focused on the bottom trend line. Once again make sure it is no bar chart as a whole that has been below the trend line ‘
‘This is a good point to enter a short position (sell). We put a stop loss above the trend line ‘
Mastering Trend Lines Forex When Do They Hold VS Breakout
Learn more about how to draw forex trend lines and use simple trend lines strategy, high low trend lines strategy as support resistance levels strategy. That forex trend lines trading strategy is profitable and learns too about tricks and tips forex trendlines.