Forex Scalping Using Renko Chart
 I want to share my knowledge of this Renko scalping system and Donchian power which I’ve gotten from the Forex forum. And I have already proved and very worth it. So for all of you if want to make consistent profit from the forex market use this scalping system because is very simple and accurate. Since I use this indicator donchian and Renko Chart is my profits continue. Because these indicators are not the usual indicators. This indicator is never too late in giving the signal, and the reply signal is only accurate at the hour London and USA sessions because at the Asia session so many frequent false signals.
There are 2 bases that I’ve used :
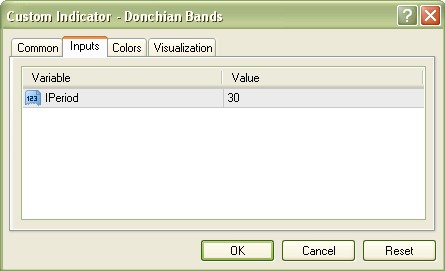
1. INDICATORS DONCHIAN Bands (IPeriod=30) on H1 Time Frame
Function:
Determine the trend
Determining target profit
And determine the stop loss
Determine the trend reversal
Do not use Donchian to the OP!!
This can be seen in the picture below :

2. Renko Chart
Function:
Determine when to enter the market
Determine the stop-loss
Never Trade on Asia Session or sideways market because there are so many false signals so only trade on LONDON and USA SESSION ONLY.
How to install Renko is attached in the manual (pdf) at the end of this article,
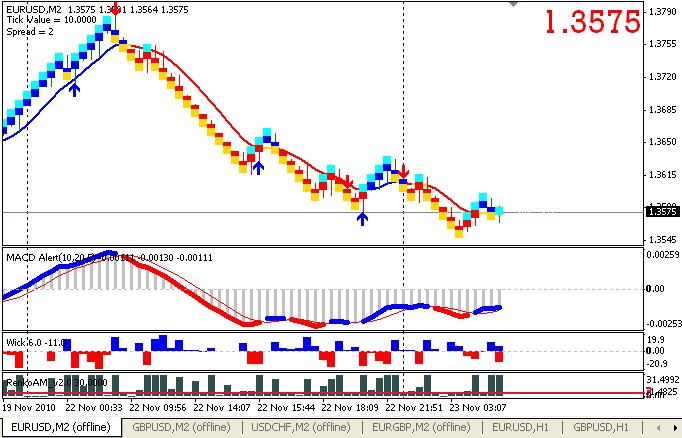
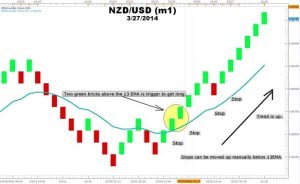
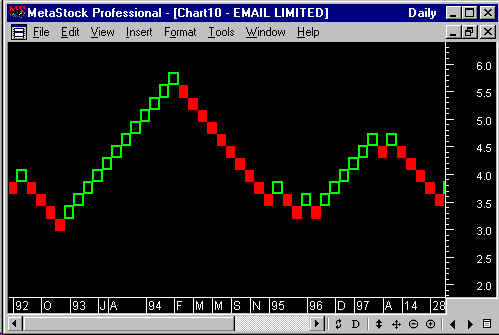
If successful then Renko’s Chart looks like the picture above.
UNDERSTANDING RULES OF :
1. DONCHIAN Bands
According to Wiki om, the Donchian line is formed by attracting the highest price and lowest price in units of time that we specify.
I’ve almost forgotten to mention above, the setting for our Donchian is 30:
so at TF H1 (1 hour), numbers above 30 will display the highest point and lowest point of the last 30 hours. Donchian bands, we will also be projecting its midpoint. Look at the picture donchian
Well, Grandpa Donchian (who discovered this individual) observed that when the price today is higher than the highest price during the last 4 weeks, then it means prices will rise. The opposite was so. When the price penetrates the lowest price during the last 4 weeks, then it means that prices will fall. This phenomenon is finally formulated a “4 weeks rule”
This simple phenomenon proved to be very powerful for decades. That’s why I started this analysis by observing the trading day of this individual. Note the picture above, where if prices break through the highest point Donchian, then prices will tend to rise steadily for several hours. Also down was the same time.
Okay, now it is kind of nice to be noticed. , Is Band Donchian middle-line us? And how prices are affected by it? Yup true … is “not aware”, Donchian middle line also serves as the line “Support / Resistance” dynamic …. awesome right … Why how come?
Note that when moving from the highest point, the price will move to the center line of this first. At this time, the center line is to the point of resistance. Often the price will bounce back up. If successfully pass the center line, then prices will tend to catch up to your bottom line Donchian. Pay attention and observe.
2. Renko Chart
If you usually do when we open the MT4 then the price will appear as Candlestick (CS) or Bar Chart (BC). Each stem represents the price movement in a one-time unit. For example, we use the H1 TF 1 bar containing pricing information OHLC (Open – High – Low – Close) in 1 hour. Or at TF W1 (weekly), then 1 bar contains information on OHLC prices within a week. The new bar is formed when a period of 1 hour (at TF H1) has been exceeded; on the TFs W1, a new bar is formed when a period of 1 week was exceeded. That is why we often see a bar whose length is different because this price movement must be different from the price movement at the other.
| Well if not guided by Renko Chart at the time. That is: time has no effect on the formation of a new bar. So who determines the formation of the new bar? Only one factor: PRICE. For example, a bar Renko is set at 10; which means every 10 pips price action it will form a new bar. Let’s say within 10 minutes the price moves from 1.9000 to 1.9030, meaning there is a movement of 30 pips ya, it will form three bars each of length 10 pips (or 10 ticks). In CS and BC at TF H1 (1 hour) this movement is not necessarily “recorded” as a new bar, as it still occurs in the same unit time. So with Renko charts, we can more quickly see where the price moves. |
Trading Strategies
Trading only in the active hours, open session Europe (Frankfurt), and the British Open. If you want more active, the overlap between the European session and the U.S. session can often continue until the closing session of the United States.
Follow the trend, the trend is your friend right …? Here, too, should be so. Make sure we are OP based on the trend. Then how do we know its trend? Using only Donchian, take a look at look at this picture:
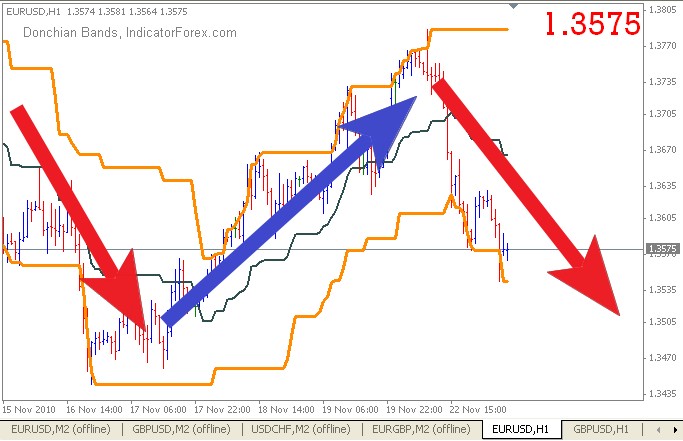
This Donchian is only for the filter, if the trend is up only buy never sell because, if the trend sells so only sell never buy, we use Donchian on H1, example If Donchian h1 says only buy so we trade only buy on m2 tf from renko chart, so renko chart and donchian have to be the same signal before we take action to trade.
The other advantages of Donchian Bands :
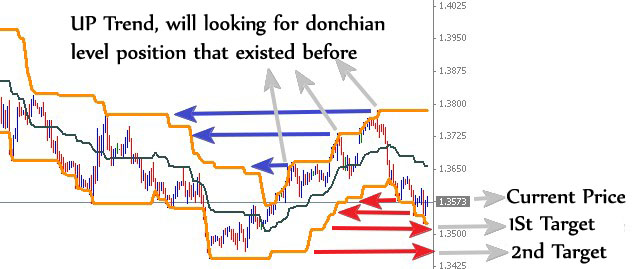
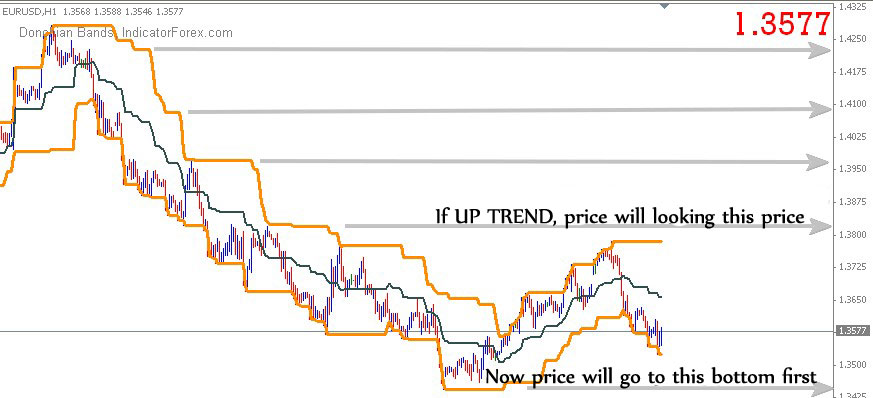

Buy Rules
1. Make sure the candles are green in color
2. Make sure the MA_in_applied price is blue
3. Make sure the candles are broken out of the 2 Moving Averages channel
4. Make sure the MACD is flipped Up and Signal is Green
5. Make sure Donchian H1 is UP TREND then enter a Buy and place the stoploss on the middle line from Donchian bands from the h1 time frame.
6. Make sure renko AM v.20 is break level 3.
Sell Rules
1. Make sure the candles are red in color
2. Make sure the MA_in_applied price is red
3. Make sure the candles are broken out of the 2 Moving Averages channel
4. Make sure the MACD is flipped Down and the Signal is Red
5. Make sure Donchian H1 is DOWN TREND then enter a Sell and place the stop loss on the middle line from Donchian bands from h1 time frame.
6. Make sure renko AM v.20 is break level 3.
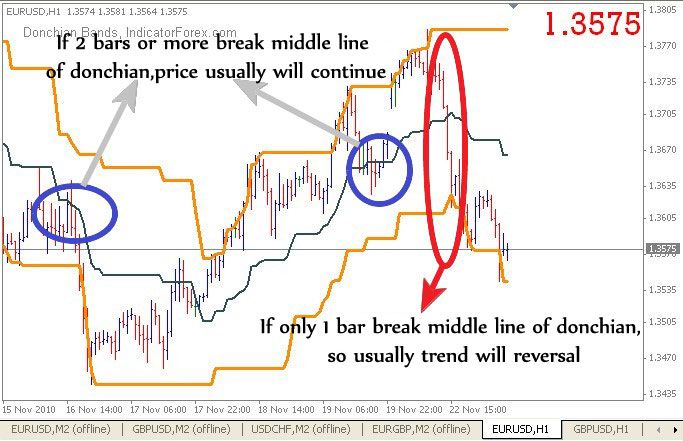
Donchian is a very powerful trading tool!
This was so powerful to the extent that a trend reversal can be seen clearly. What I need to emphasize here is the words “usually” in the picture above. My observations so far have I pour there, but surely there will be times when the opposite occurs.
The logic is this:
1. If the price of “playing around” in the middle line Donchian is too long, it is a sign prices are not strong enough to penetrate / her journey. It can be concluded: that the current trend will continue.
2. If the price is not playing around in the middle line of Donchian, but immediately cut off with a bar alone, meaning the trend has full power to continue the journey. Which can be concluded: the trend will change.
| So, in one pair there are 3 charts: – Chart 1: TF M1, containing active EA RenkoLive Chart – Chart 2: TF H1, contains Donchian with Iperiod 30 – Chart 3: M2 Offline, contains Renko bars (using template renko m2 scalping) |
Chart 1 only filled the EA, and is not required for analysis. So these chart settings just once, and already it can be forgotten (but not closed, because the Renko chart is a bar to get “data” to form a bar by bar.
Charts 2 and 3 will often be monitored to analyze and execute the analysis results.
3 charts are needed for a pair. So if we want to analyze two pairs means the MT4 chart 6 we will open it.
Conclusion
This strategy can be used for 14 pairs because this system uses average form from multiple time frames so gives us the best price action signal. But my experience using GBPUSD, EURUSD, AUDJPY, and USDCHF is the best. Donchian bands as scalping indicators work very well on a four-hour time frame or at least on a one-hour time frame for intraday traders.
Download and manually install from this great combination Renko Donchian HERE. This simple scalping strategy is very useful but still wise with your money management and don’t forget to use a good forex broker for scalping too.
Scalping trading still prioritizes trends in large time frames, and the way to read the current trend is to use price action analysis. From here we can understand how the market structure occurs, including how prices will meet the liquidity area, including the strength of resistance which can be read through the shadows of several candlesticks that occur in a support resistance area or supply demand zone. This combination method is known as the Smart Money Concept.
Intraday Trading Strategies For Intraday Scalping Traders
This Renko Donchian is great for intraday strategy for intraday forex traders.
Smart Money Concepts (SMC) is a trading strategy that focuses on understanding the actions and motives of influential entities, such as banks and hedge funds, in the market. It involves replicating the trading behavior of these entities and analyzing variables like supply, demand dynamics, and market structure. SMC introduces specific terminology, including Order Blocks, Fair Value Gaps, and Liquidity, which are key elements in analyzing market movements. The strategy is based on the premise that influential entities play a deliberate role in market movements, and retail traders are advised to construct their strategies around the activities of “smart money.”
SMC is not just a Forex trading strategy, but an entire philosophy about how the markets work. It states that market makers are manipulative entities that conduct trading activity at specific levels. According to SMC, as a retail trader, you should base your strategy on what is happening with the “smart money.” SMC traders refer to ideas like “liquidity grabs” and “mitigation blocks.” While their terminology may seem complex, when you examine SMC, you will realize it is a more traditional trading approach than it appears at a glance. The most common terms used in smart money concepts are; Break of Structure (BOS), Change in Character (CHOCH), Shift of Market Structure (SMS), Order Blocks, and Fair Value Gap (FVG).
SMC involves using classic Forex concepts like supply and demand, price patterns, and support and resistance to trade, but the concepts have been renamed and described differently. SMC is a price action trading strategy that focuses on understanding the actions and motives of influential entities in the market. It is a comprehensive approach that provides a strategic framework for traders to analyze and interpret market movements based on the behavior of the “smart money.”
In conclusion, Smart Money Concepts (SMC) provide traders with a strategic framework that focuses on understanding the actions and motives of influential entities in the market. It involves replicating the trading behavior of these entities and analyzing variables like supply, demand dynamics, and market structure. SMC introduces specific terminology, including Order Blocks, Fair Value Gaps, and Liquidity, which are key elements in analyzing market movements. This approach aligns with traditional trading ideas and contributes to a deeper understanding of market movements.
