Median Line And Stochastic Over Sold Over Bought As Momentum For Entry Swing Levels
The following strategy is a swing trading method developed at Austin Financial Group. This method combines the median line and the slow stochastic indicator. The Stochastic indicator is the most widely used momentum indicator in financial analysis. In the swing trading strategy it is assumed that the trader knows about the Stochastic indicator and a basic discussion of this indicator’s formula is not presented. The settings for the Slow Stochastic indicator used with this method are a 14-bar look-back period, an oversold level of 20, and an overbought level of 80. Median Line theory states that a Median Line drawn from the most recent pivots will see the price reach the Median Line about 80% of the time. The stochastic theory holds that when a market is moving in a cyclical mode and the Slow Stochastic moves below the oversold line, a bottom is forming. If the Slow Stochastic moves above the overbought line, a top is forming. This is not true in trending markets.
Using the two market theories mentioned above it is possible to find high probability pivots to trade by watching for the price to reach the Median Line when the Stochastic is oversold or overbought.
Rules Using Median Line Strategy
The Buy Setup
Step 1: Draw a downward-sloping Median Line from the most recent pivots.
Step 2: Apply a Slow Stochastic to the chart.
Step 3: Watch for the price to move down to the Median Line and the Slow Stochastic to become
oversold at the same time.
Step 4: If the conditions in Step 3 are met, buy long on any observation that the market has turned
upward.
Also Read Article :
The Sell Setup
Step 1: Draw an upward-sloping Median Line from the most recent pivots.
Step 2: Apply a Slow Stochastic to the chart.
Step 3: Watch for the price to move up to the Median Line and the Slow Stochastic to become
overbought at the same time.
Step 4: If the conditions in Step 3 are met, sell short on any observation that the market has turned
downward.
Detail with picture
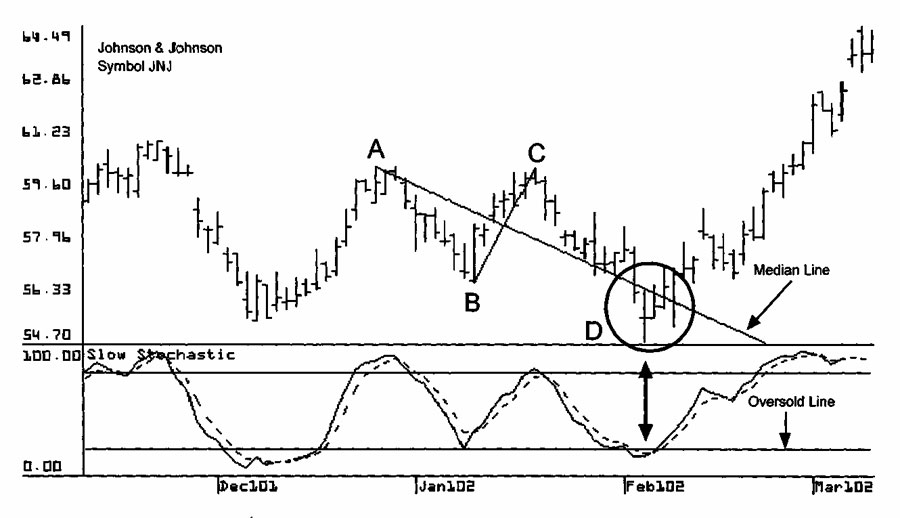
The chart above shows Johnson and Johnson, symbol JNJ. A downward-sloping Median Line is drawn using pivots A, B, and C. The Slow Stochastic is applied to this chart. The price falls to the Median Line at point D and the Slow Stochastic is also below the oversold line. This is a high-probability swing trade setup at which a trader buys long the swing bottom at point D and holds for the next upswing.
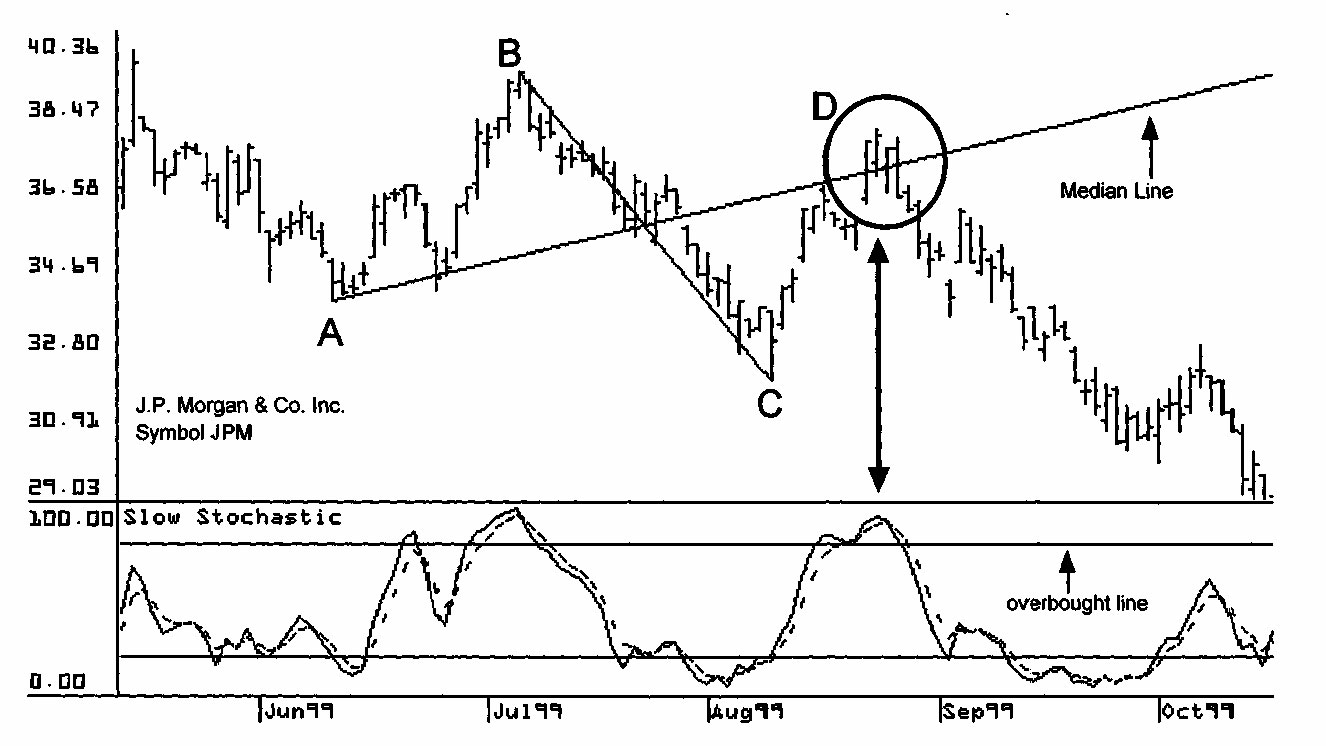
The chart below uses data on J.P. Morgan, symbol JPM. An upward-sloping Median Line is drawn using pivots A, B, and С and a Slow Stochastic is added to the chart. The price increases to the Median Line at point D and the Slow Stochastic is also above the overbought line. This is a high-probability swing trade setup. A trader would sell short the swing top at point D and hold for the next downswing.
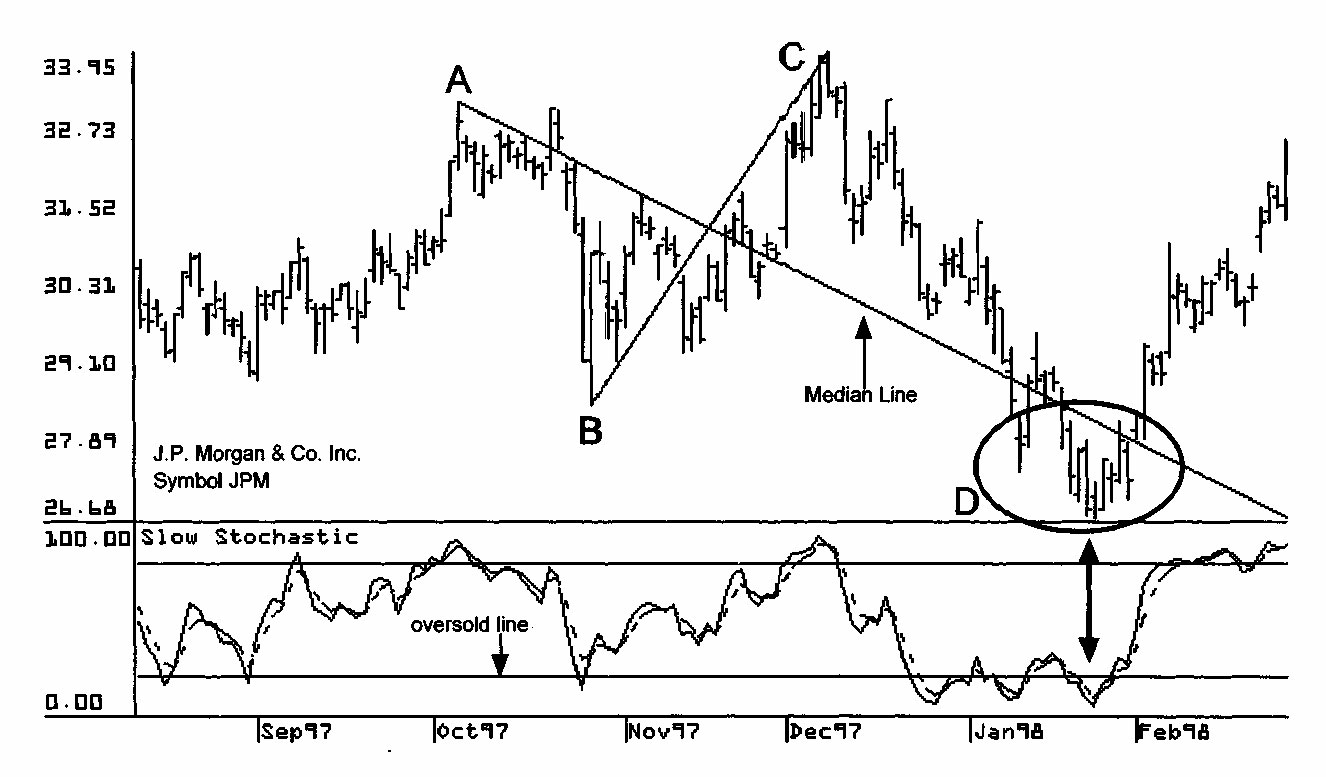
The picture above shows a second chart for J.P. Morgan, symbol JPM. A downward sloping Median Line is drawn using pivots A, B, and С and a Slow Stochastic is added to the chart. On this chart, the price falls to the Median Line at point D and the Slow Stochastic is also below the oversold line. This is a high-probability swing trade setup where a trader buys long the swing bottom at point D and holds for the next upswing.
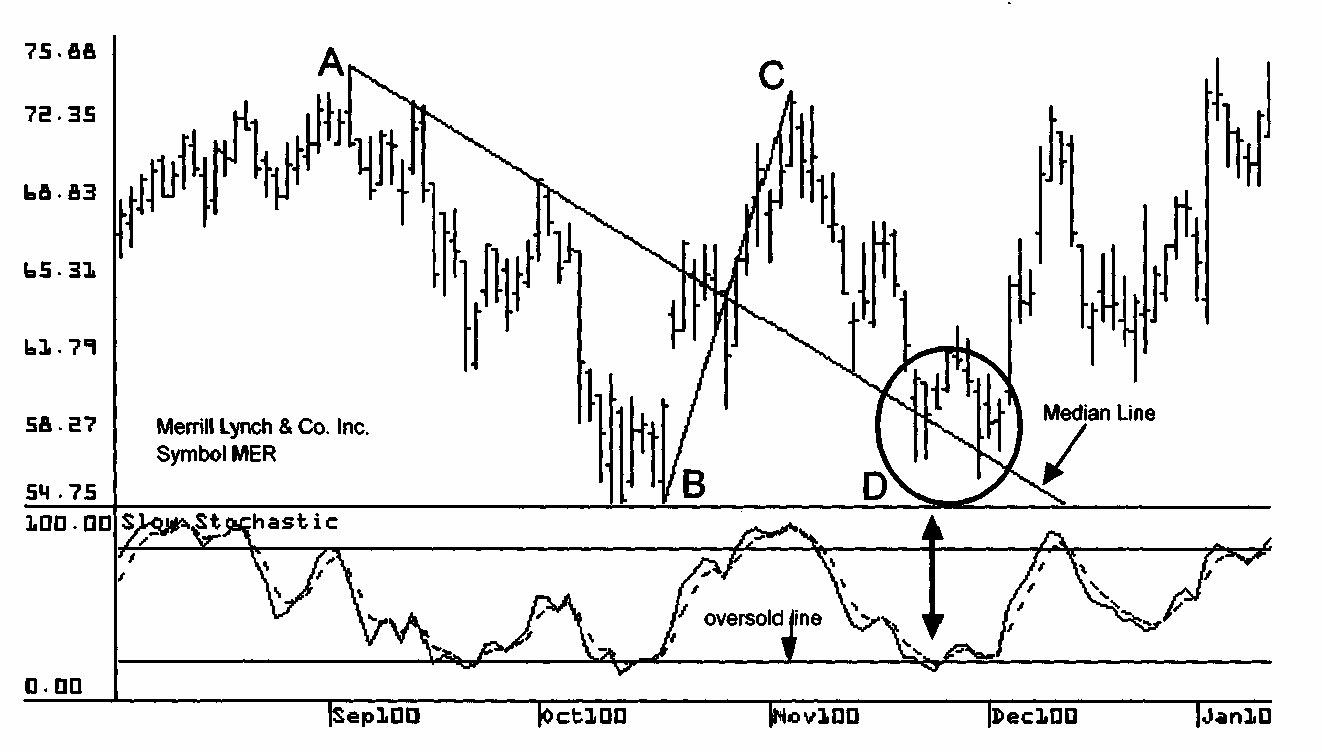
In this picture below there is a chart for Merrill Lynch, symbol MER. A downward sloping Median Line is drawn using pivots A, B, and С and a Slow Stochastic indicator is added to the chart. On this chart, the price falls to the Median Line at point D and the Slow Stochastic is also below the oversold line. This is a high-probability swing trade setup. A trader buys long the swing bottom at point D and holds for the next upswing.
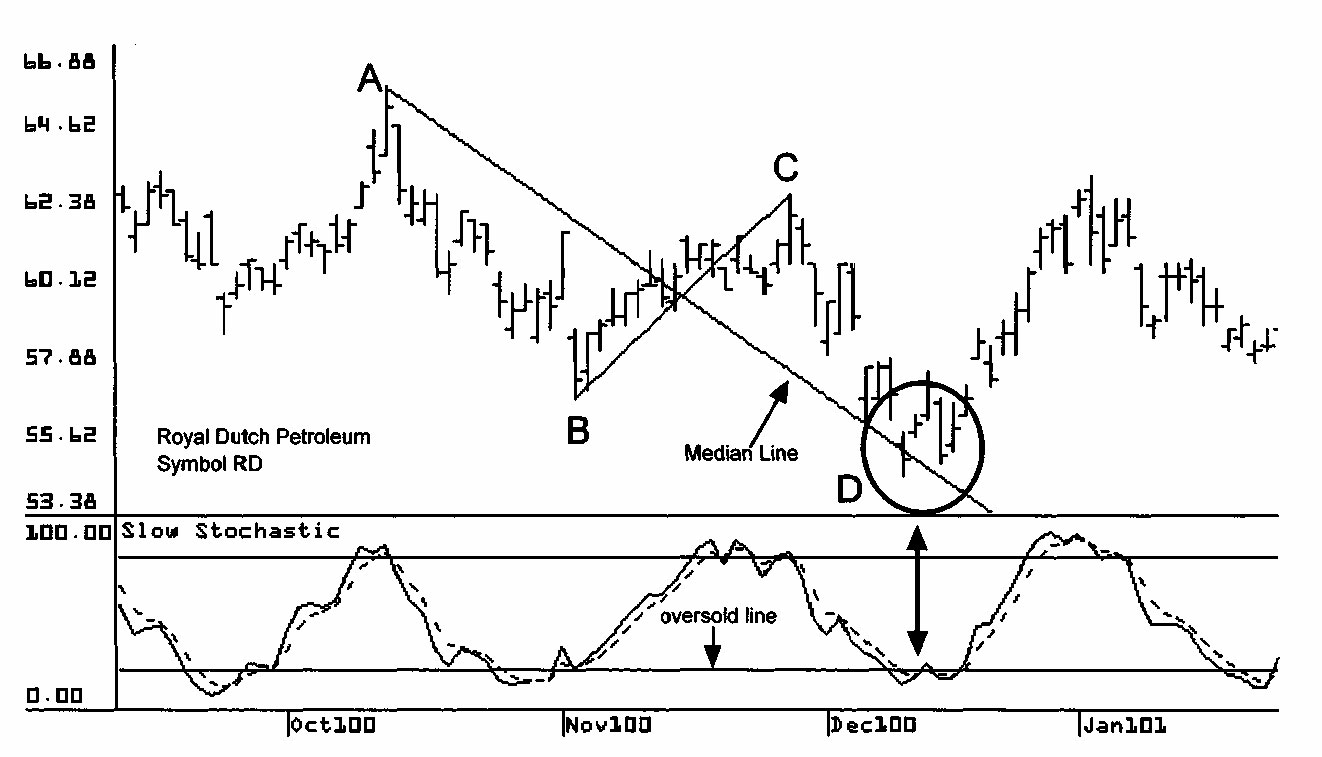
The picture above contains a chart for Royal Dutch Petroleum, symbol RD. A Median Line is drawn using pivots A, B, and С and a Slow Stochastic indicator is added to the chart. On this chart, the price falls to the Median Line at point D and the Slow Stochastic is also below the oversold line. This is a high-probability swing trade setup at which a trader buys long the swing bottom at point D and holds for the next upswing.
Also Read Article :
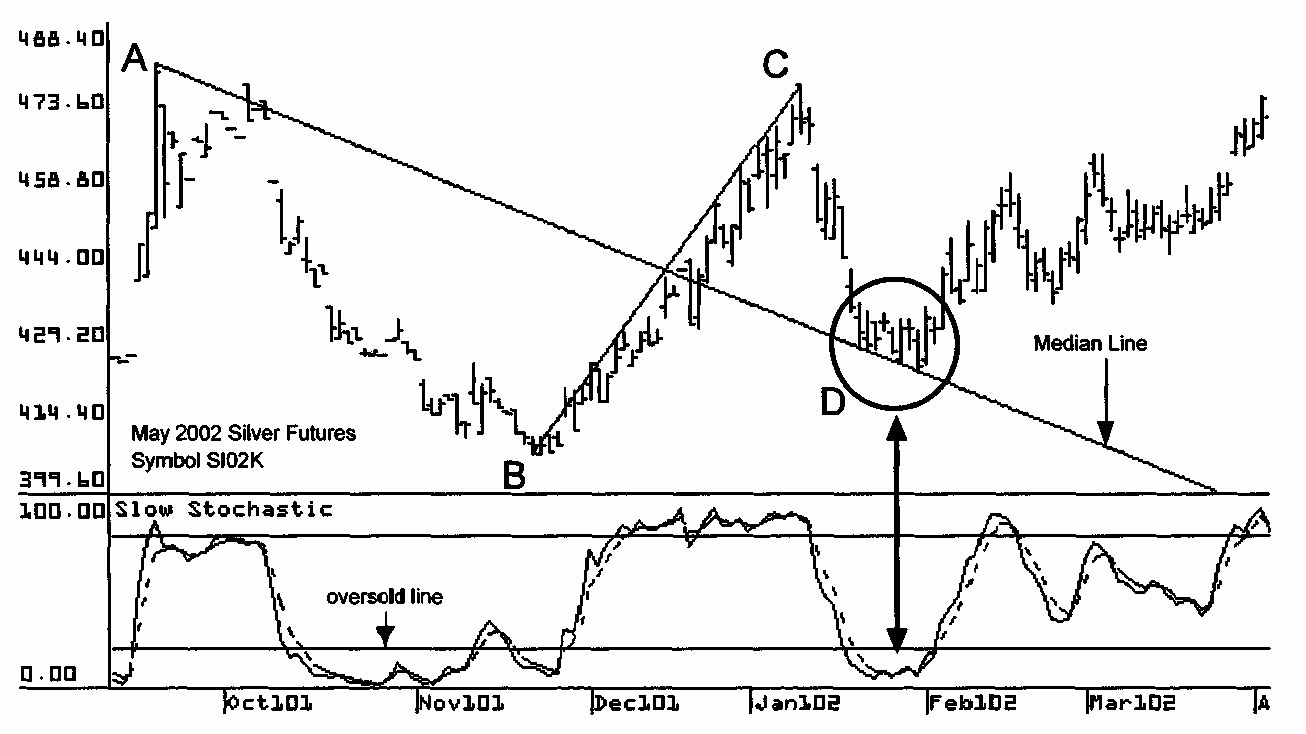
In this picture below is a chart for May 2002 Silver futures. A Median Line is drawn using pivots A, B, and С and a Slow Stochastic is added to the chart. On this chart, the price falls to the Median Line at point D and the Slow Stochastic is also below the oversold line. This is a high-probability swing trade setup point at which a trader buys long the swing bottom at point D and holds for the next upswing.
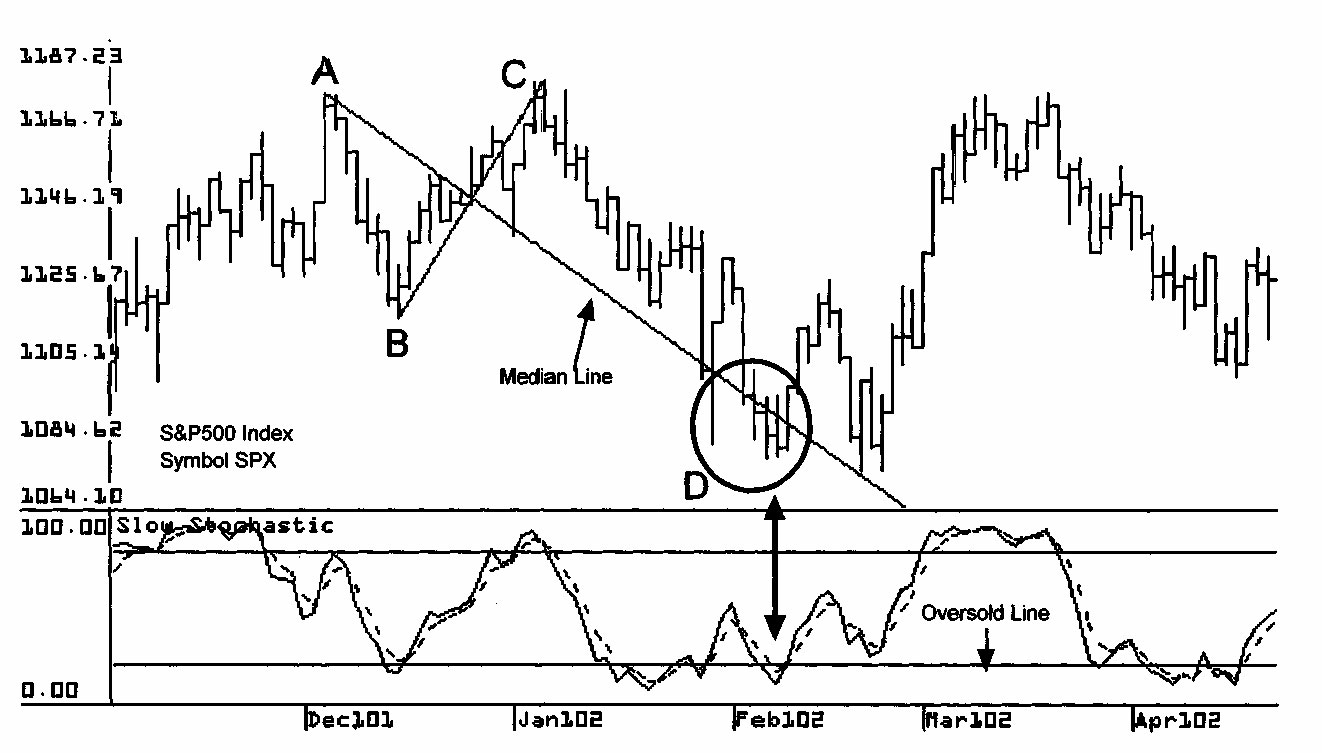
The picture above has a chart for the S&P500 Index, symbol SPX. Pivots A, B, and С are used to draw a Median Line, and a Slow Stochastic is also drawn on the chart. On this chart, the price falls to the Median Line at point D and the Slow Stochastic is also below the oversold line. This is a high-probability swing trade setup situation in which a trader buys long the swing bottom at point D and holds for the next upswing.
The picture below is a chart for Tellabs, symbol TAB. A Median Line is drawn using pivots A, B, and С, and a Slow Stochastic is positioned on the chart.
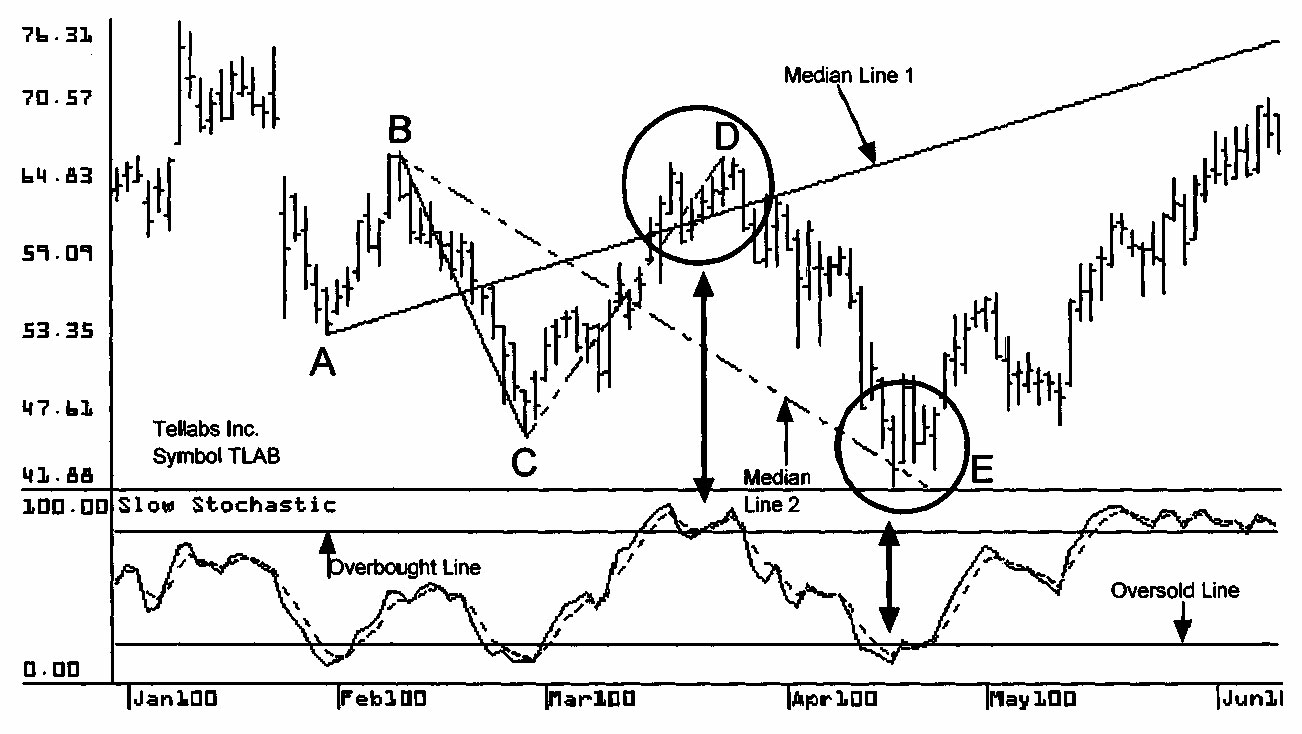
The price increases from pivot С to the Median Line at point D and the Stochastic is also above the overbought line. This is a high-probability swing trade setup. A trader sells short the swing top at point D and holds for the next downswing. Next, a second Median Line is drawn using pivots В, С, and D. The price falls from pivot D to the second Median Line at point E and the Stochastic is also below the oversold line. This is another high-probability swing trade setup. This time a trader buys long the swing bottom at point E and holds for the next upswing.
Also Read Article :
Learn too about how to trade using intraday trading strategy based on liquidity areas and get profit daily faster!!
Practice wise money management in using this median or pivot trading strategy in the ROBOFOREX PRO CENTS Account first.
