Ten Forex Trading Rules Before Made Trading Decisions That You Should Understand
Here our top forex trading rules that will give us high forex risk reward ratio :
| 1. Map the Trends 2. Spot the Trend and Go With It 3. Find the Low and High of It 4. Know How Far to Backtrack 5. Draw the Line 6. Follow That Average 7. Learn the Turns 8. Know the Warning Signs 9. Trend or Not a Trend? 10. Know the Confirming Signs |
 |
Map the Trends : Study long-term charts. Begin a chart analysis with monthly and weekly charts spanning several years. A larger scale map of the market provides more visibility and a better long-term perspective on a market. Once the long-term has been established, then consult daily and intra-day charts. A short-term market view alone can often be deceptive. Even if you only trade the very short term, you will do better if you’re trading in the same direction as the intermediate and longer term trends.
Spot the Trend and Go With It : Determine the trend and follow it. Market trends come in many sizes – long-term, intermediate-term and short-term. First, determine which one you’re going to trade and use the appropriate chart. Make sure you trade in the direction of that trend. Buy dips if the trend is up. Sell rallies if the trend is down. If you’re trading the intermediate trend, use daily and weekly charts. If you’re day trading, use daily and intra-day charts. But in each case, let the longer range chart determine the trend, and then use the shorter term chart for timing.
 |
 |
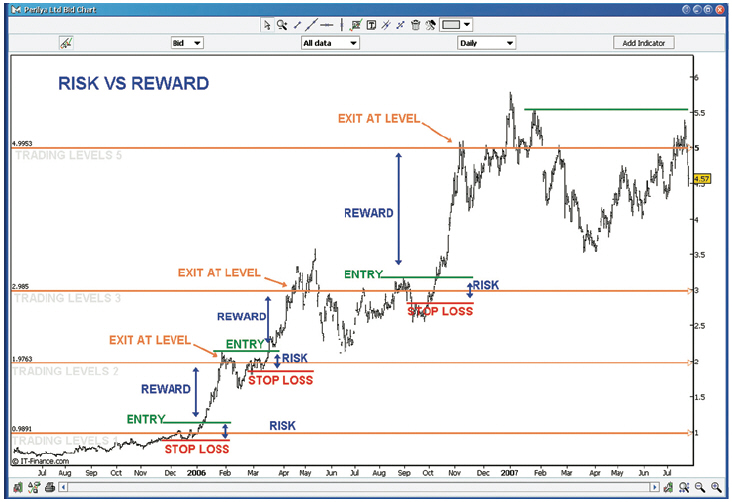
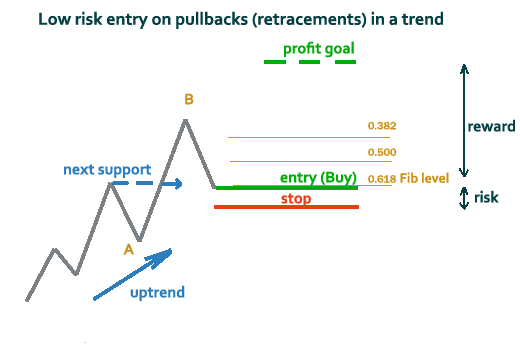
Find the Low and High of It : Find support and resistance levels. The best place to buy a market is near support levels. That support is usually a previous reaction low. The best place to sell a market is near resistance levels. Resistance is usually a previous peak. After a resistance peak has been broken, it will usually provide support on subsequent pullbacks. In other words, the old “high” becomes the new low. In the same way, when a support level has been broken, it will usually produce selling on subsequent rallies – the old “low” can become the new “high.”
Know How Far to Backtrack : Measure percentage retracements. Market corrections up or down usually retrace a significant portion of the previous trend. You can measure the corrections in an existing trend in simple percentages. A fifty percent retracement of a prior trend is most common. A minimum retracement is usually one-third of the prior trend. The maximum retracement is usually two-thirds. Fibonacci retracements of 38% and 62% are also worth watching. During a pullback in an uptrend, therefore, initial buy points are in the 33-38% retracement area.
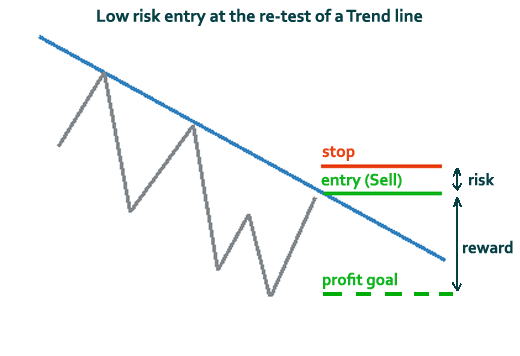
Draw The Line : Draw trend lines. Trend lines are one of the simplest and most effective charting tools. All you need is a straight edge and two points on the chart. Up trend lines are drawn along two successive lows. Down trend lines are drawn along two successive peaks. Prices will often pull back to trend lines before resuming their trend. The breaking of trend lines usually signals a change in trend. A valid trend line should be touched at least three times. The longer a trend line has been in effect, and the more times it has been tested, the more important it becomes. Trend line is very helpful in determine strong support resistance levels. Because on this strong support resistance levels we should take a trades.
Follow That Average : Follow moving averages. Moving averages provide objective buy and sell signals. They tell you if existing trend is still in motion and help confirm a trend change. Moving averages do not tell you in advance, however, that a trend change is imminent. A combination chart of two moving averages is the most popular way of finding trading signals. Some popular futures combinations are 4- and 9-day moving averages, 9- and 18-day, 5- and 20-day. Signals are given when the shorter average line crosses the longer. Price crossings above and below a 40-day moving average also provide good trading signals. Since moving average chart lines are trend-following indicators, they work best in a trending market.
Learn The Turns : Track oscillators. Oscillators help identify overbought and oversold markets. While moving averages offer confirmation of a market trend change, oscillators often help warn us in advance that a market has rallied or fallen too far and will soon turn. Two of the most popular are the Relative Strength Index (RSI) and Stochastics. They both work on a scale of 0 to 100. With the RSI, readings over 70 are overbought while readings below 30 are oversold. The overbought and oversold values for Stochastics are 80 and 20. Most traders use 14-days or weeks for stochastics and either 9 or 14 days or weeks for RSI. Oscillator divergences often warn of market turns. These tools work best in a trading market range. Weekly signals can be used as filters on daily signals. Daily signals can be used as filters for intra-day charts.
Know The Warning Signs : Trade MACD. The Moving Average Convergence Divergence (MACD) indicator (developed by Gerald Appel) combines a moving average crossover system with the overbought/oversold elements of an oscillator. A buy signal occurs when the faster line crosses above the slower and both lines are below zero. A sell signal takes place when the faster line crosses below the slower from above the zero line. Weekly signals take precedence over daily signals. An MACD histogram plots the difference between the two lines and gives even earlier warnings of trend changes. It’s called a “histogram” because vertical bars are used to show the difference between the two lines on the chart.
Trend or Not a Trend : Use ADX. The Average Directional Movement Index (ADX) line helps determine whether a market is in a trending or a trading phase. It measures the degree of trend or direction in the market. A rising ADX line suggests the presence of a strong trend. A falling ADX line suggests the presence of a trading market and the absence of a trend. A rising ADX line favors moving averages; a falling ADX favors oscillators. By plotting the direction of the ADX line, the trader is able to determine which trading style and which set of indicators are most suitable for the current market environment.
Know The Confirming Signs : Include volume and open interest. Volume and open interest are important confirming indicators in futures markets. Volume precedes price. It’s important to ensure that heavier volume is taking place in the direction of the prevailing trend. In an uptrend, heavier volume should be seen on up days. Rising open interest confirms that new money is supporting the prevailing trend. Declining open interest is often a warning that the trend is near completion. A solid price uptrend should be accompanied by rising volume and rising open interest.
Attention
If we follow this simple ten forex trading rules above, i think we can get success in forex. It’s very logic to trend with a right trend if we follow major trend from big time frame like daily, it will give us a big reward than loss of trading. More over if we can understanding market movement based major reversal candlestick patterns confirmation which is read from strong support resistance levels from four hour time frame or daily time frame. It will give us a accuracy of trading.
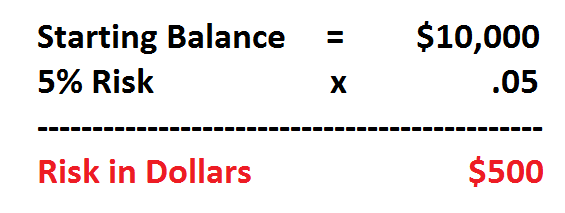
Never using high laverage, maximum laverage is only 1:500, never use 1:1000 laverage, because it’s fake and can cheating in our margin calculation. And write you trading journal to back-test your trading strategy, is it accurate enough or not ?