Heiken Ashi Trading Strategy
A collection of simple trading systems that may already be familiar to lovers of Heiken ashi. Where heiken Ashi in addition capable of displaying a picture of strength following the price movement trend is also to reduce the “noise” in price movements. The Heiken Ashi forex trading strategy is a popular method for intraday trading, known for its ability to smoothen price movements and identify trends effectively. Here’s a detailed description of the strategy, including step-by-step instructions and key principles:
Key Principles and Concepts
The Heiken Ashi strategy is based on Heiken Ashi candlesticks, which are calculated using a modified formula to create a “smoother” representation of price action. This makes it easier to identify trends and potential reversal points compared to traditional candlestick charts.
Candle heiken ashi has different basic calculations when compared with ordinary candles on the chart that displays the price including open, high, low, and close.
As for heiken ashi can be briefly described as follows:
1. Open price; an average of opening and closing the previous candle.
2. Close price; an average of open, high, low, and close price.
3. A high price; is an open or closed price, which has the highest value.
4. A low price; is an open or closed price, which has the lowest value.
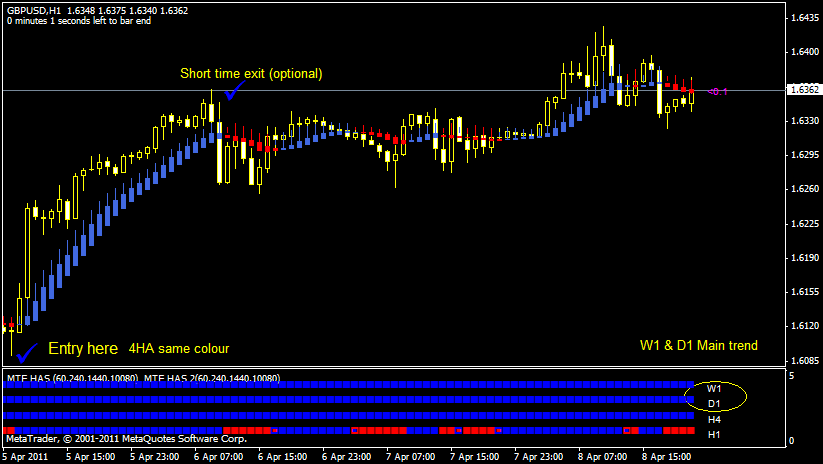
The trading system this time only relies on ashi heiken. In the chart above I use 4 TF heiken ashi as scaning trend direction and heiken ashi smoothed for execution.
2 Heiken Ashi with a time frame of reference used as the main trend.
Also Read Article :
You can use this system in the time frame of 1 hour (H1) or if you want to be lazy (like me …;- p) use this system in the time frame of 4 hours (H4).
Buy if:
1. Make sure all the bars are heiken ashi blue.
2. Make sure the price is above the heiken ashi smooth which is also colored blue.
3. You can exit the partial if one of the bars on 4HA changes color to red.
or you can lock whatever they can profit from during the scans the main trend is still showing a bullish trend.
Sell if:
1. Make sure all the bars are heiken ashi red.
2. Make sure the price is below Heiken Ashi smooth which is also red.
3. You can exit the partial if one of the bars on 4HA changes color to blue.
or you can lock whatever they can profit from during the scans the main trend still shows a bearish trend.
Download Heiken Ashi Trading Template
Just download the Heiken Ashi trading strategy here.
Test in with our recommended regulated forex brokers in the list below first to start this Heiken-Ashi forex strategy.
What Are The Key Components of The Heikin Ashi Forex Trading Strategy
The key components of the Heiken Ashi forex trading strategy include:
- Heiken Ashi Candlesticks: The Heiken Ashi candlesticks are a modified version of traditional candlesticks that help to filter out market noise and provide a clearer representation of market trends and direction.
- Identifying Trends: The Heiken Ashi strategy is used to identify trends in the market, including potential reversals and continuation patterns.
- Support and Resistance Levels: The Heiken Ashi strategy can be used to identify potential support and resistance levels based on the patterns and color changes of the Heiken Ashi candlesticks.
- Confirmation with Other Indicators: The Heiken Ashi strategy can be combined with other technical indicators, such as moving averages or trendlines, to confirm signals and increase the probability of successful trades.
- Intraday Trading: The Heiken Ashi strategy can be effectively applied in intraday trading by selecting an appropriate time frame, such as 15 minutes or 1 hour, and using the Heiken Ashi candlesticks to identify potential trading opportunities.
By focusing on these key components, traders can effectively apply the Heiken Ashi forex trading strategy for intraday trading, helping to identify trends, support and resistance levels, and potential trading opportunities. The best time frame to use is 4H and Daily to follow the current major trend looking for price action trading signals confirmation in 5-minutes or m15 time frame.
Remember to learn too about what is liquidity trading zone and support resistance break trading strategy to get more accurate in trading signals confirmation as always. By following these steps and considering the key principles of the Heiken Ashi strategy, traders can effectively apply this method for intraday trading on the MetaTrader 4 platform.


