Trend line or in the language of its forex trend line is often called, is the most common and basic form of technical analysis. Where this trend line could signal a reversal, retracement, or selling/buying. But the fact is also much less utilize trend line traders in analyzing the movement of prices (chart).
If drawn correctly, the trend line can provide accurate signals for other technical analysis methods.
It often happens that traders do not make a trend line according to market conditions (a true rule), on the contrary, they draw a line per the wishes of their subjective trading strategy.
Okay, so how interesting are trend lines properly?
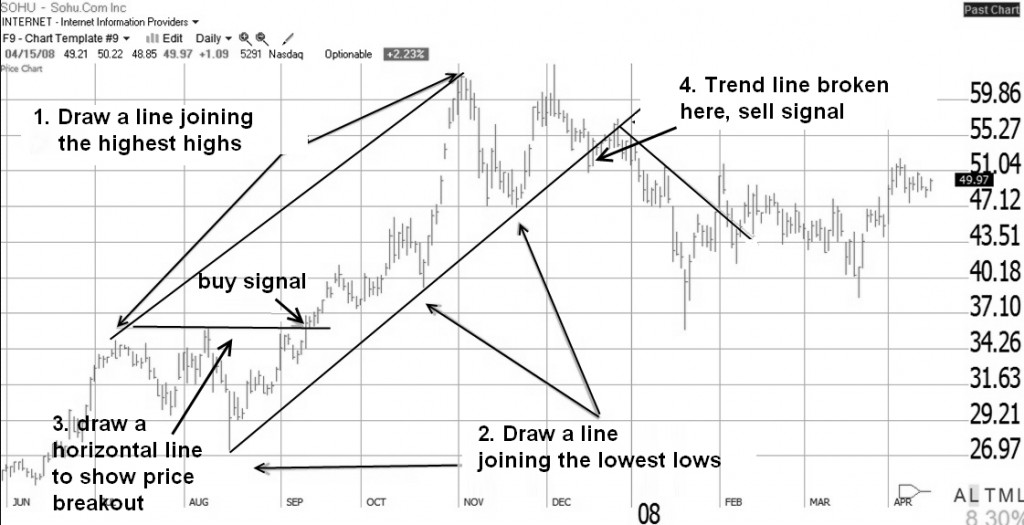
First Line uptrend / Bullish:
The line drawn along the points/areas of support (the valley), which means at the bottom of the price movement (chart)
Second Line downtrend / Bearish
The line drawn along the points/areas of resistance (peak), which means at the top of the price movement (chart)
Because this form is the line then the requirement to draw a line is you can find 2 points or 2 point support resistance and tail. Tail in this case could be interpreted as a point to 3 which is the point of confirmation. Alternatively withdrawing from the 3-point line will obtain quality trends more accurately.
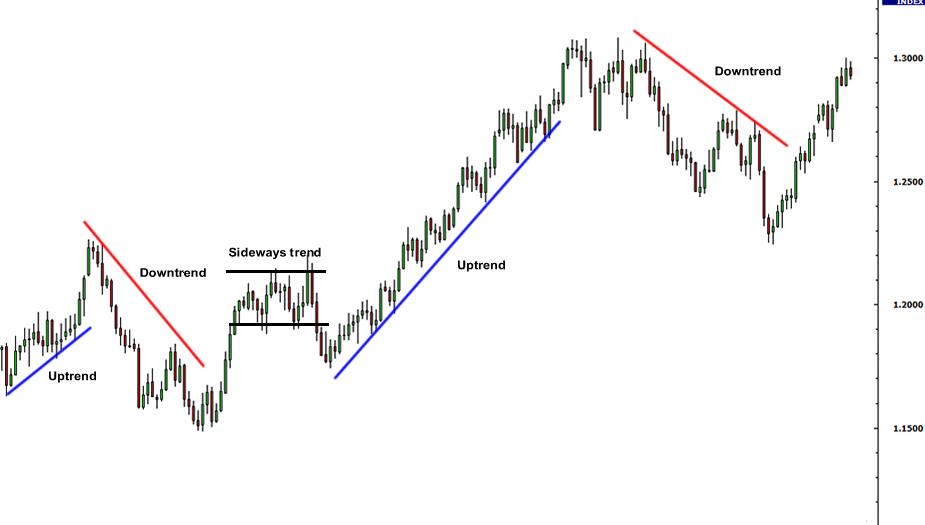
Well, let’s see the illustrations below. You can see examples of how to draw a line trendline. There are 3 types of common trend-line lines, namely:
* Uptrend: a bullish trend line (blue line)
* Downtrend: a bearish trend line (red line)
* Sideways Trend: trend line sideways / sideway (black line)
Some important things to remember about the trend line:
* It takes at least 2 points peak or valley to draw trend lines are valid but need the points to 3 to confirm the trend line.
* If you find a trend line that falters, or in other words not in a straight line lengthwise, the trend may soon end and there was a break (change trends). The more disconnected terraces, the larger the trend.
* Outline the trend will get stronger / invalid if they succeed through the test. Where the price movement/support/resistance can not be hit (break) lines.

* And most importantly, DO NOT force the draw trend lines to be per the wishes of trading (analysis) alone, or with market conditions though. If, after you describe the rules that did not fit right and mean left alone, assuming the current trend line line what’s the use?
* In the application of forex trading (stocks, etc.), facilities or tools to draw a general outline have been provided. But the question of where to draw the line where you alone remain to decide.
How to Predict Trendline Breakouts – Complete Trendlines Forex Trading Tutorial
13 Trendline Forex Trading Tips and Tricks You Ever Need
Good luck and analyze with a trend line forex indicators! And learn more about how to identify support resistance zone-based trendlines from professional forex traders, so we can get the best areas to buy on deep zone forex trading range to maximize our profits.