On this occasion, we will learn how to identify valid institutional candles and how to prevent them from avoiding the trap of manipulating market movements so as not to be fooled and misguided in reading trends in forex trading.
What Is Institutional Candle
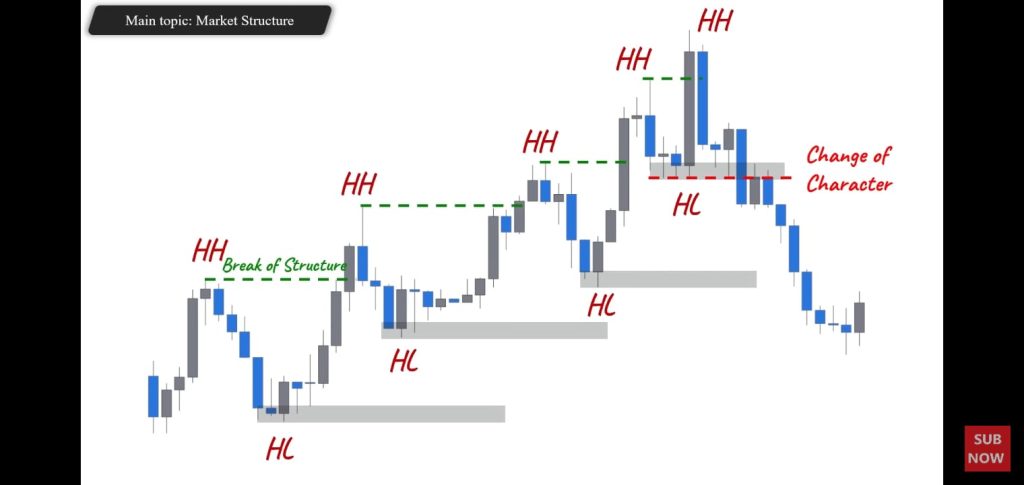
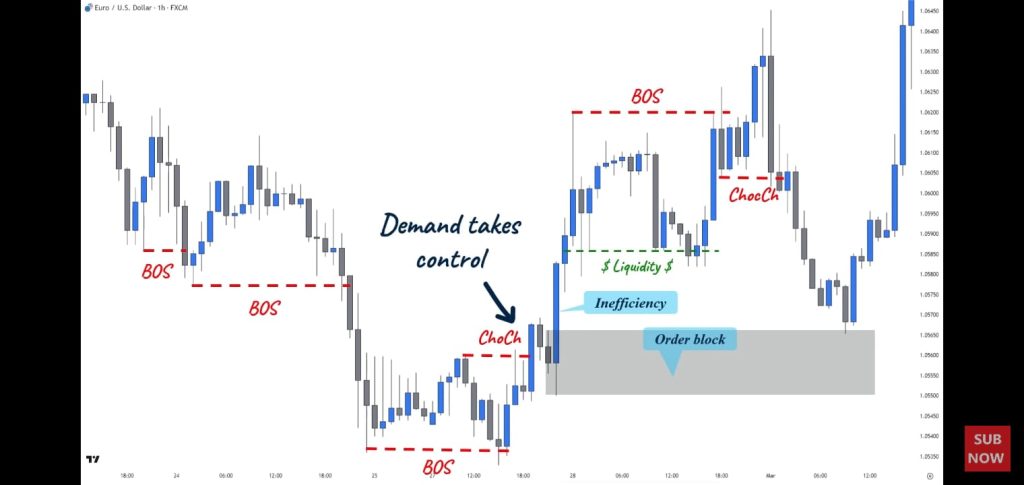
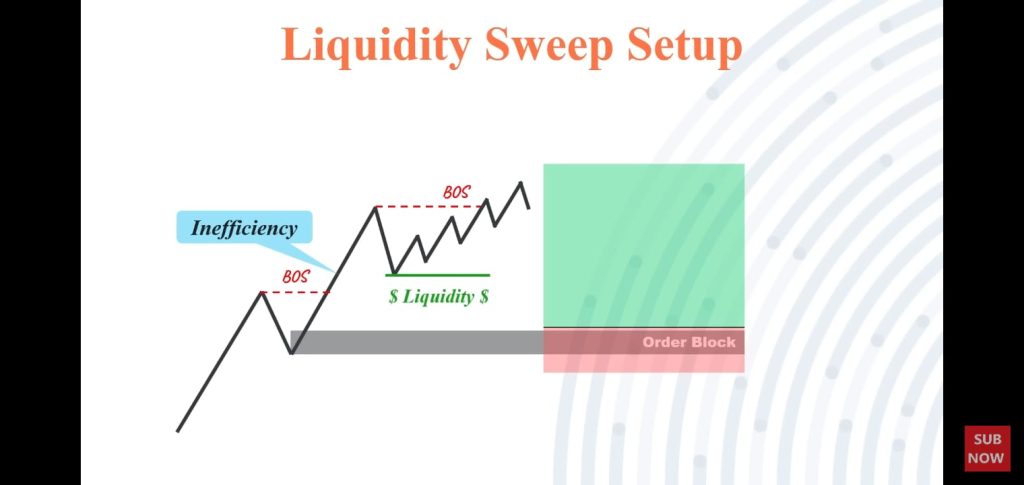
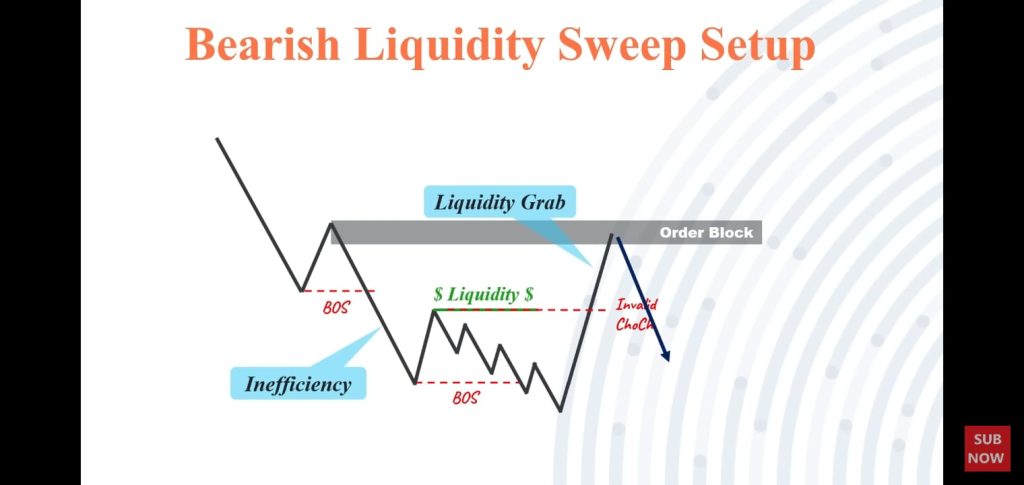
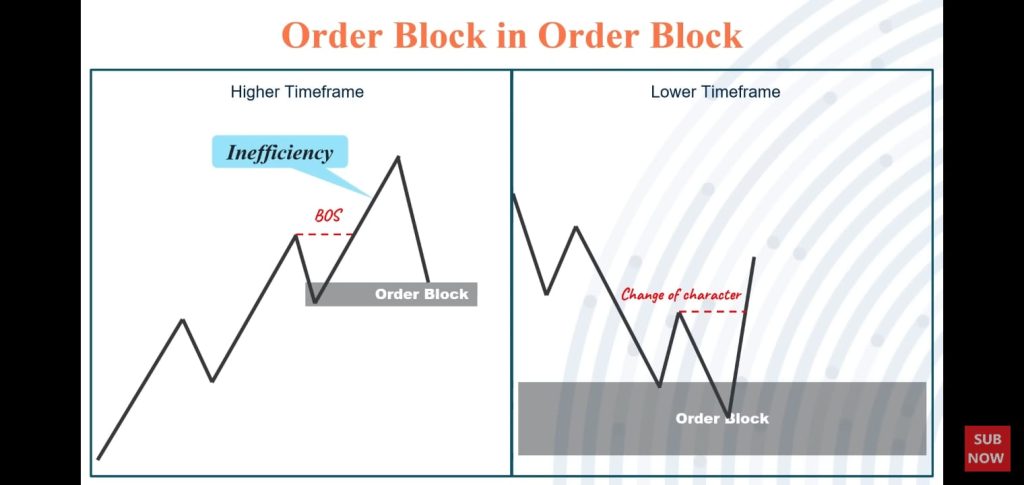
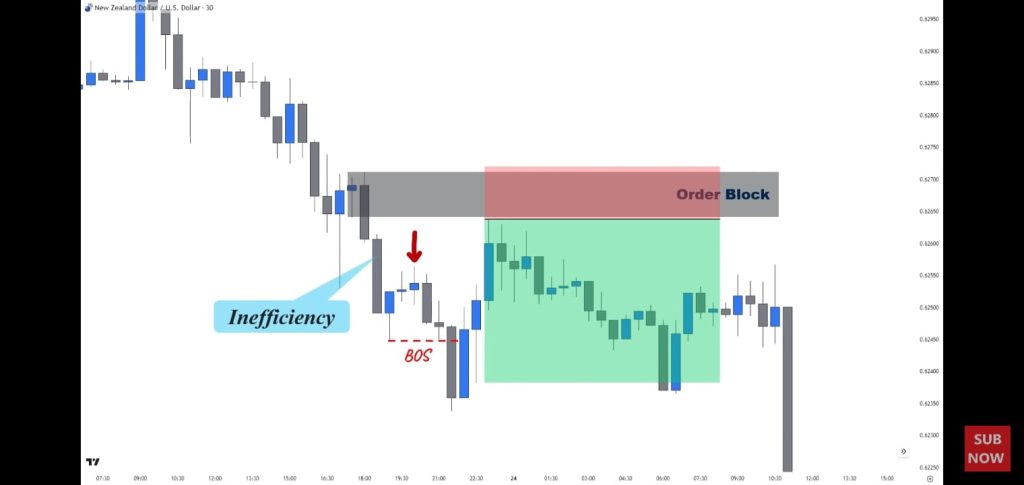
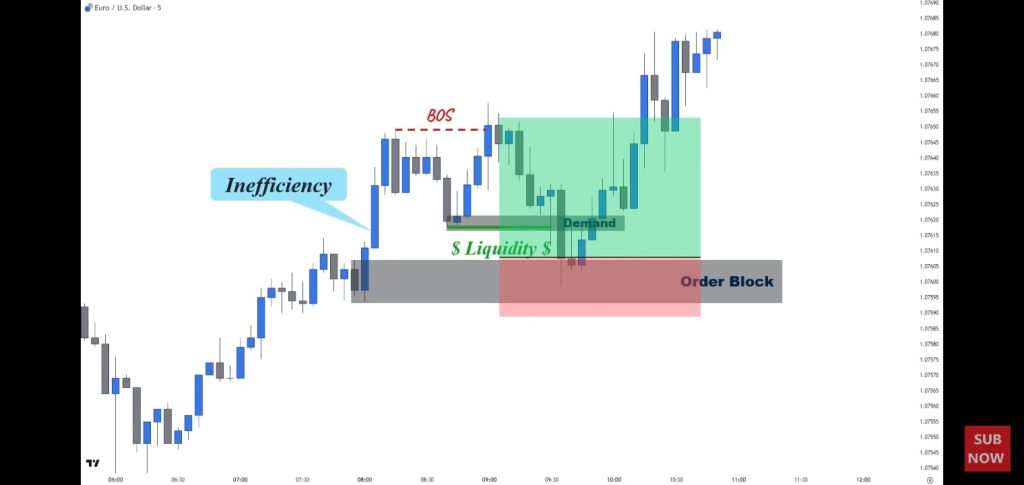
Institutional Candles often called order blocks are candles final bullish or bearish after a support and resistance breakout occurs so making the distribution of market prices occur or is called trends. Based on experience, Valid Institutional Candles only formed after the support resistance area or sideway area a breakout has occurred, then the price returns to the sideways zone again that was just broken out, and the price returns to the breakout of the last high or last low, still in the previous sideways area. Or can It be easy to say like this, when the price forms an equal low in the support area then the price moves lower and breaks below equal lows, or support candles have big bodies and deep rejection wicks and the price creates fear value gaps (FVG) or imbalance on the way up and vice versa. This is how not to get trapped by manipulation of breakout support resistance.
The following is a complete video explanation about institutional candle validation and how we trade using these order blocks
Trading Forex with the Institutional Candle Strategy
Trading forex using the institutional candle strategy involves analyzing candlestick patterns combined with smart money concepts to make trading decisions based on the behavior of institutional traders. Here are the steps and key concepts to consider when using this strategy:
1. Understanding Institutional Candle Strategy
- The institutional candle strategy is based on the premise that institutional traders leave behind specific price action patterns in the forex market, which can be used to make informed trading decisions.
In this first step, we need to identify which good or bad order blocks, here is how we identify fake or best order blocks to trade.
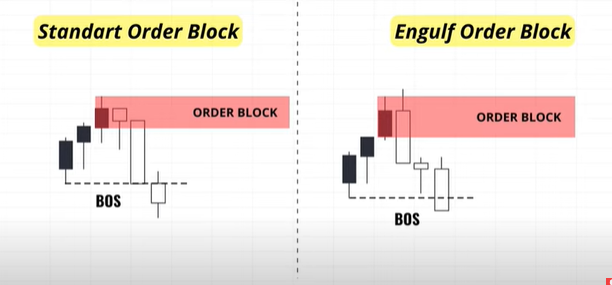
Good Order Blocks are order blocks that have the power to break structure (BOS), create a fear value gap (BOS), and are unmitigated.
Another preference is to identify a good order block that can be used for accurate signals. The right one with the engulf order block is better and stronger than the left one.
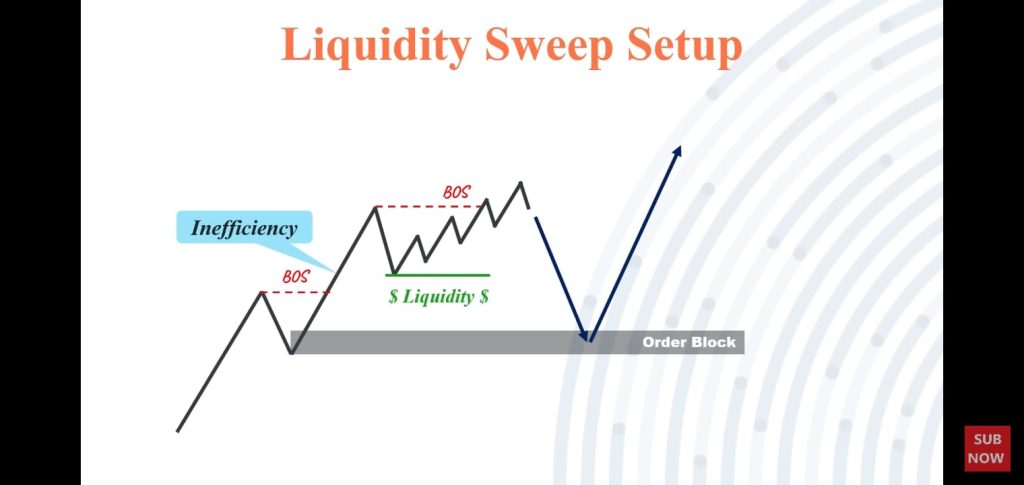
This is a simple requirement on how to see valid order blocks, and of course, it needs to be combined with a liquidity trading strategy.
2. Identifying Key Candlestick Patterns
- Learn to identify key candlestick patterns such as engulfing patterns, doji candles, pin bars, and inside bars. These patterns often indicate potential reversals or continuation of trends.
3. Use of Support and Resistance Levels
- Incorporate the identification of support and resistance levels to validate the significance of the candlestick patterns. Institutional traders often make their moves at these crucial levels.
4. Utilizing Volume and Time Analysis
- Consider analyzing trading volume and time of day when specific candlestick patterns occur. Institutional traders tend to execute significant trades during specific hours, leading to recognizable patterns in volume and timing.
5. Incorporating Technical Indicators
- Use technical indicators such as moving averages, relative strength index (RSI), and stochastic oscillators to confirm the signals generated by the candlestick patterns. This can help strengthen your trading decisions.
6. Risk Management
- Implement proper risk management techniques by setting stop-loss orders and adhering to strict risk-to-reward ratios for each trade. This is crucial in forex trading to protect your capital.
7. Backtesting and Practice
- Before implementing the strategy in live trading, backtest the institutional candle strategy on historical data to gauge its effectiveness. Additionally, practice on a demo account to gain confidence in executing trades based on the strategy.
8. Continual Learning and Adaptation
- Stay updated with market news, economic events, and changes in institutional trading behavior. Continually adapt and refine your strategy based on new insights and developments in the forex market.
Tips To Avoid Failed Breaker Blocks This Way
Learn more about Flipped Zone In Forex Market Structure – Completed Guide For Advanced Trader
By following these steps and understanding the key concepts of the institutional candle strategy, traders can potentially make informed trading decisions in the forex market based on the behavior of institutional traders. And, what you need to remember is that the liquidity zone will only occur after the sideways area breaks out, therefore this institutional candle plays a powerful role in forming market movement trends.


