Intermarket analysis can be accurate above 90% if we calculate all variables. This technique is very wealthy. Popular single-market technical analysis indicators such as moving averages and chart pattern formations are lagging indicators that look retrospectively at an individual market’s past data to identify reoccurring patterns that can then be extrapolated into the future. This type of analysis boils down to looking at where the market has been and trying to guess where it is going.
Since the objective of technical analysis is trend identification and forecasting, it would stand to reason that this goal could best be achieved by working with leading indicators that anticipate changes
in trend direction.
I prefer to forecast market direction prospectively in a manner that captures the character and nature of today’s interdependent financial markets. This can be accomplished by using intermarket analysis tools
comprised of leading indicators that forewarn whether an existing trend is likely to continue or is about to change direction. This takes the guesswork out of trading.
Intermarket Analysis in the Equity and Commodity Markets
The intermarket analysis had its genesis in both the equity and commodity markets. Traditional technical analysis within the equity markets has historically looked at relationships among individual stocks,
sectors and broad market indexes.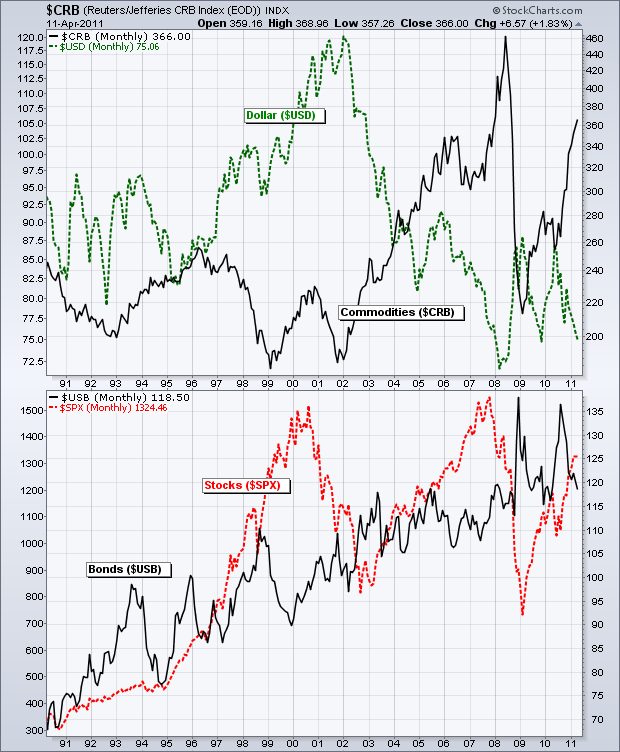
More recently, comparisons between broad market indexes representing various stock markets around the world have been made.
Intermarket analysis within the equity markets includes the following comparisons:
• Domestic broad market indexes to one another.
• Market sectors to the broad market indexes.
• Individual stocks to broad market indexes.
• Individual stocks to one another within a sector.
• The relationship of price, time, and volume to one another.
• The advance/decline line compared to the performance of broad market indexes.
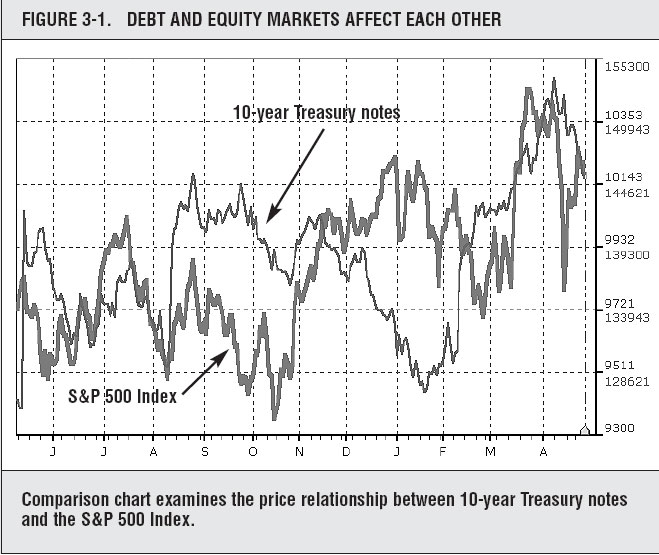
• Movements in interest rates to movements in stock indexes such as the relationship between 10-year Treasury notes and the S&P 500
• Stock indexes, such as the Nikkei 225 and FTSE 100, are compared to similar market indexes in other countries such as U.S. stock indexes including The DowSM or Nasdaq.
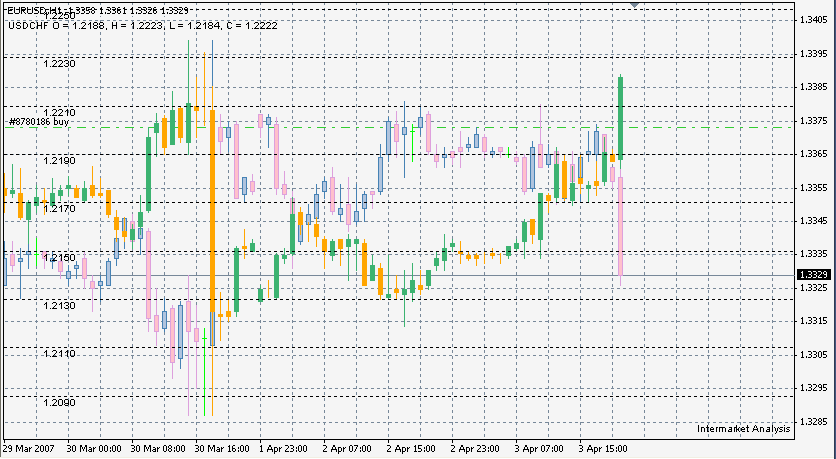
So this relevance from the us index, Dow Jones, NASDAQ, Nikkei, and Hansen has had a very significant effect on the currency. A good and complete price for using inter-market analysis is listed by forex brokers below. Their mt4 provides completed instruments from currency, stocks, options, metals, and also indexes of course. This ebook about Intermarket analysis can be downloaded here to study more detail so we can predict the forecast of direct trends. Remember still using “new high/low” as a new valid support resistance on at least four hour and daily time frame to add some limit order and tight money management.
Ultimate Intermarket Analysis Course for Traders
Test this inter-market market strategy with a cents forex account at roboforex first.