Support Resistance With Trendline
This is my experience from using trend lines as our good support and resistance even if we never see again news value from the forex factory, but if you still need to see news from the forex factory it is fine too just for confirmation. Usually, I’ve used this strategy to adjust support and resistance in the 15-time frame or m30 time frame and entry price in a 5-minute time frame. This method uses a simple strategy, only draw high to high to see a low reversal for buy and low to low to see a high reversal for sell. Here sample picture from my trading room :
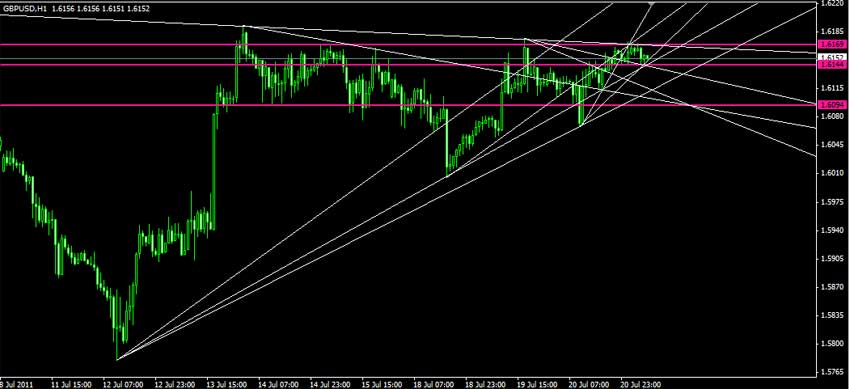
Support Resistance With Trendline
Based on the picture above we can set pending limit order buy or sell depending on the major trend and have tight stop loss below or above from support and resistance plus spread, you can see a major trend on the H4 or H1 time frame by using only alligator and awesome oscillator. The most important tips: You can sell limit at top resistance and buy limit at low support, looking for 10-25pips is easy.
Remember use have to cut loss and switch position if you ride on wrong way so need tight mm, if you practice routinely and the discipline of course you will get power from this trendline line, and is very accurate in determining support and resistance moreover I like best with a scalping strategy, this is the easiest technique to achieve 10-20pips per day consistently.
Murrey Math Forex Indicator Download
Here sample picture again which I combined with 9 squared MM or Murray Math forex indicator, the result support and resistance are almost the same.
To effectively trade using trendlines as support and resistance levels and to generate highly accurate trading signals, traders can follow these step-by-step instructions and use specific indicators or tools for optimal trading results:
- Identifying and Drawing Trendlines:
- Trendlines are drawn by connecting at least two significant price points on a chart. An upward trendline is drawn by connecting two or more low points, and a downward trendline is drawn by connecting two or more high points.
- Use the “Peaks and Troughs” method to identify significant high and low points on the chart. Draw the trendline by connecting these points to visualize the prevailing trend.
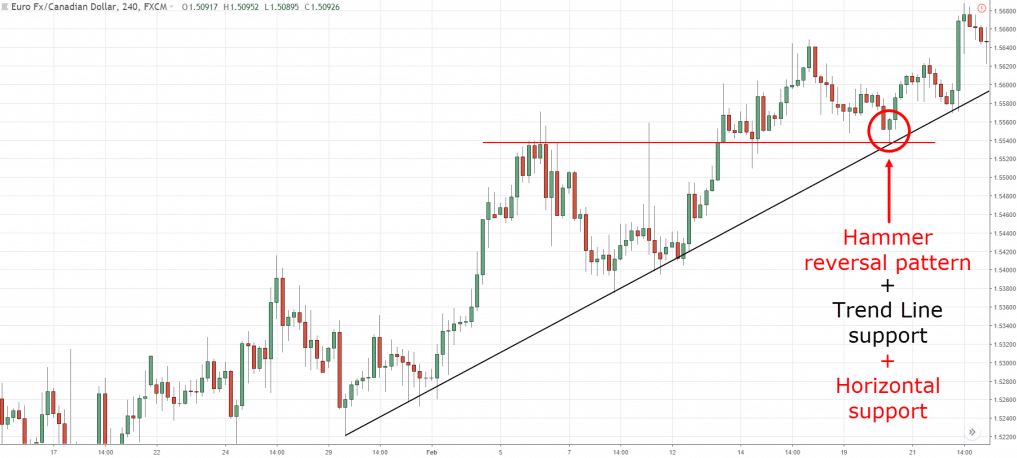
- Interpreting Price Action with Trendlines:
- When the price approaches a trendline, observe how it reacts. If the price bounces off an upward trendline, it may indicate a potential buying opportunity. Conversely, if the price bounces off a downward trendline, it may signal a potential selling opportunity.
- Look for candlestick patterns, chart patterns, and other technical indicators to confirm the trading signals generated by the trendlines.
- Using Additional Indicators or Tools:
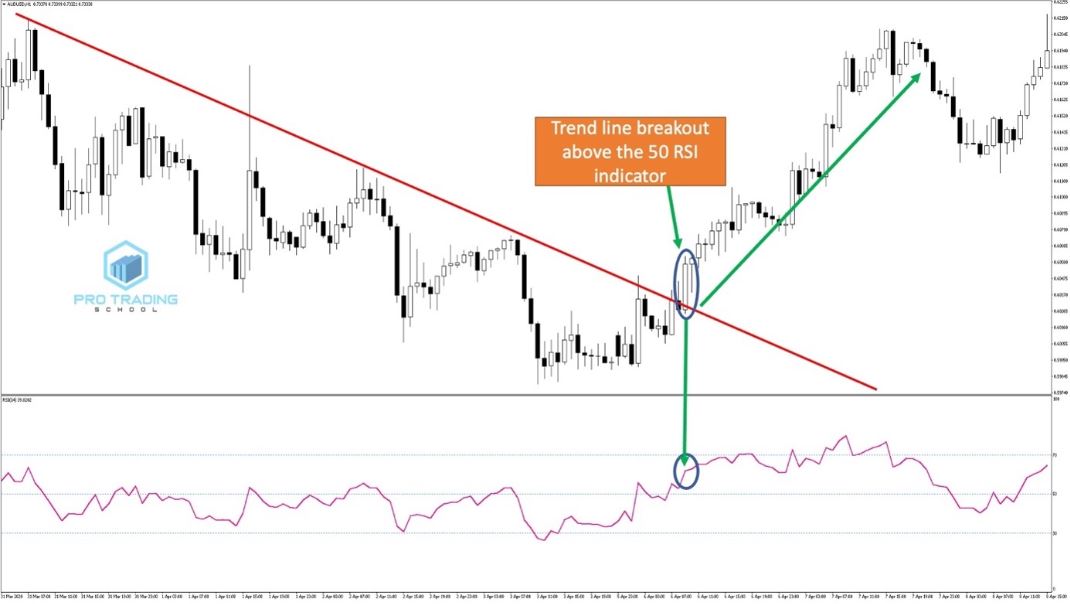
- Combine trendlines with other technical analysis tools, such as moving averages, Candlesticks Reversal Patterns Strategy, Pin Bar Forex Strategy, RSI, and chart patterns, to enhance the effectiveness of the trading strategy.
- Consider using support and resistance indicators, such as the Donchian Trend Signals or the VWAP Range indicator, to complement the analysis based on trendlines.
How To Use Trendlines To Identify Support and Resistance Levels
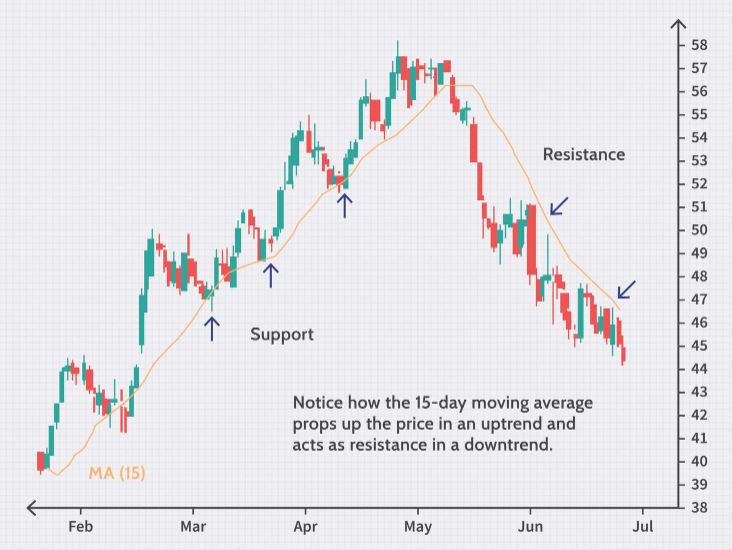
To use trendlines to identify support and resistance levels, you need to draw the trendlines on the chart by connecting at least three peaks or troughs. In an uptrend, the trendline is drawn below the price, while in a downtrend, the trendline is drawn above the price. Once you have plotted the trendlines onto your chart, the uptrend line will be the support level, while the downtrend line will be the resistance level. You can also use moving averages to identify dynamic support and resistance levels, which are constantly changing. To trade based on support and resistance levels, you should wait for the price to approach or touch the support or resistance levels and monitor the price action for signs of reversal or breakthrough. It’s important to combine one or more methods to establish the most accurate support and resistance levels.
By following these steps and using the recommended indicators or tools, traders can effectively use trendlines as support and resistance levels to generate highly accurate trading signals. It’s important to practice identifying and drawing trendlines using historical charts to gain proficiency in applying this strategy. Additionally, traders should always use proper risk management techniques and test their strategies in a demo account first or open a real cents account before trading with real money.
Conclusion
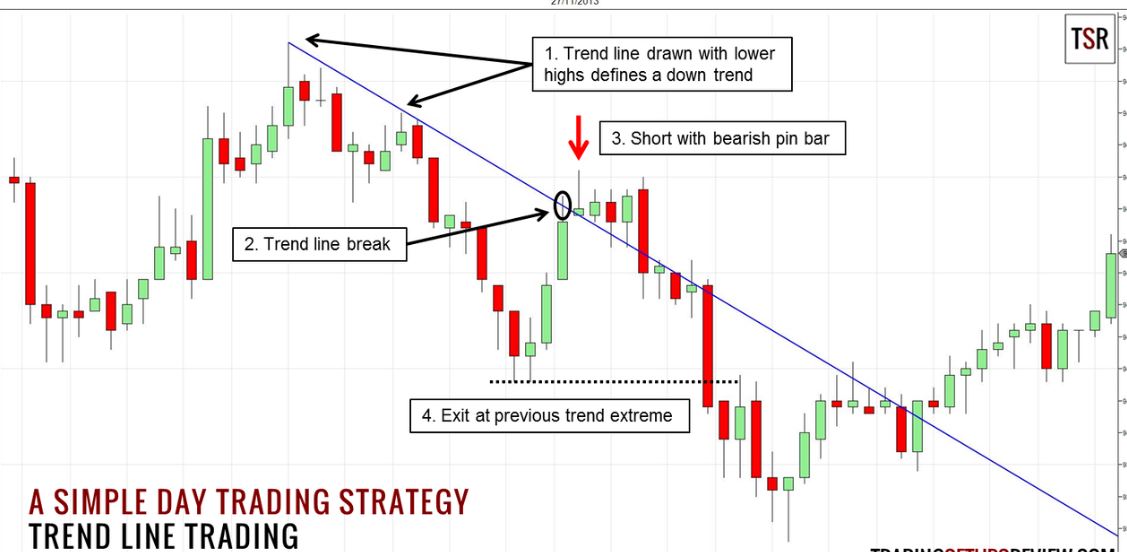
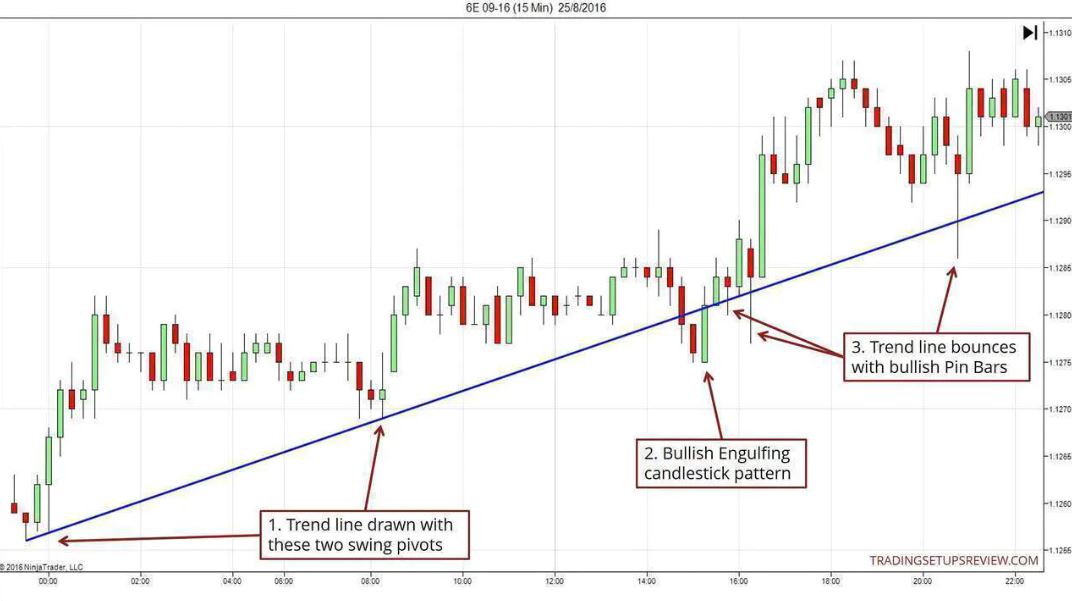
Another simple example of a trendline trading strategy is below : 
This is what I have learned about the world of investing over three decades. I try each day to stand by my rules. I fail miserably at times, for I break them often, and when I do I lose money and mental capital, until I return to my rules and try my very best to hold strongly to them. The losses incurred are the inevitable tithe I must make to the markets to atone for my trading sins. I accept them, and I move on, but only after vowing that “I’ll never do that again.” Remember this support resistance level with trend lines analysis still needs to be filtered with candlesticks basics patterns to get more accurate forex signals in making trading decisions. Test with cents account first to start this trend line strategy.
One of the best indicators for determining support resistance levels is the trendline. It turns out that with this trend line, we can do forex scalping very easily. Here’s the tutorial video.