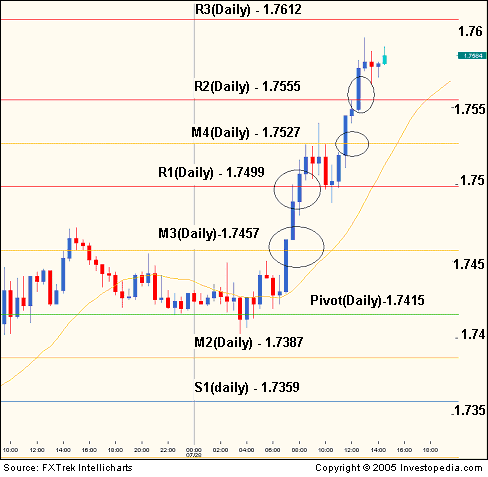
As intraday forex traders, one of the simple methods in getting accurate forex trading signals is calculating support resistance based on previous high-low methods so we can get a pivot level. That is all represented by the pivot calculator so we can get an accurate price for the entry signal. But all this support resistance is more effective if we combine these support resistance levels with economic indicators value.
I’ve got these simple forex pivot indicators from my friend. This indicator works great, and we can enable old pivots that indicate with grey line.
Just try it, almost every price reaches support 1 or resistance 1 in reverse. The green line is pivot line-based daily.
Just download this great daily pivot indicator and try the test combined with your daily trading strategy. If you found a good idea for using this great pivot indicator, so please share it with us at: dollarsniper@yahoo.com
 The following is how to trade using the pivot breakout strategy and it is very suitable for getting daily profits. Pivots that have never been visited by price seem to function as price magnets because basically, the pivot level is a neutralizing price area that must be met by the market before re-determining the new strike price.
Pivot Points and Their Role in Trading
Pivot points are a popular technical analysis tool used by traders to identify potential support and resistance levels in the market. These are calculated based on the previous day’s price data and serve as an important reference point for traders to make trading decisions.
How Pivot Points Act as Important Support and Resistance Levels:
Pivot points are important because they represent potential turning points in the market. If the price is above the pivot point, it indicates a bullish bias, and if it is below it, it indicates a bearish bias. A pivot point also can be as a filter to identify the liquidity zone. If breaks up it indicates the price goes to liquidity areas on top, and vice versa.
Combining Price Action & Liquidity Zones: The Ultimate Trader’s Blueprint!
The first support level (S1) and resistance level (R1) are considered minor levels, and the second level (S2, R2) and third level (S3, R3) are considered more important levels.
Traders use pivot points to identify support and resistance levels and decide where to enter or exit a trade. For example, a trader can buy at a support level or sell at a resistance level. The pivot point also acts as a breakout point. If the price breaks above the resistance level, it could indicate a bullish breakout, and if it falls below the support level, it might indicate a bearish breakout.
Additionally, pivot points can be used to set stop-loss and take-profit levels, allowing traders to manage risk and optimize their risk-reward ratio.
Overall, pivot points are valuable to traders because they provide a framework for understanding market sentiment, identifying important levels, and making trading decisions based on the interaction of those levels with price. It’s a great tool.
The calculation of pivot points involves four levels:
Pivot Point (PP):
The pivot point itself is the average of the previous day’s high, low, and close prices.
PP = (Previous Day’s High + Previous Day’s Low + Previous Day’s Close) / 3
Resistance Level 1 (R1) and Support Level 1 (S1):
The first resistance level (R1) is calculated by multiplying the pivot point by 2 and subtracting the previous day’s low.
R1 = (2 * PP) — Previous Day’s Low
The first support level (S1) is calculated by multiplying the pivot point by 2 and subtracting the previous day’s high.
S1 = (2 * PP) — Previous Day’s High
Resistance Level 2 (R2) and Support Level 2 (S2):
The second resistance level (R2) is calculated by adding the previous day’s high to the difference between the pivot point and the previous day’s low.
R2 = PP + (Previous Day’s High — Previous Day’s Low)
The second support level (S2) is calculated by subtracting the difference between the pivot point and the previous day’s high from the pivot point.
S2 = PP — (Previous Day’s High — Previous Day’s Low)
Resistance Level 3 (R3) and Support Level 3 (S3):
The third resistance level (R3) is calculated by adding the previous day’s high to twice the difference between the pivot point and the previous day’s low.
R3 = PP + 2 * (Previous Day’s High — Previous Day’s Low)
The third support level (S3) is calculated by subtracting twice the difference between the pivot point and the previous day’s high from the pivot point.
S3 = PP — 2 * (Previous Day’s High — Previous Day’s Low)


