Trading With Elliott Wave Patterns
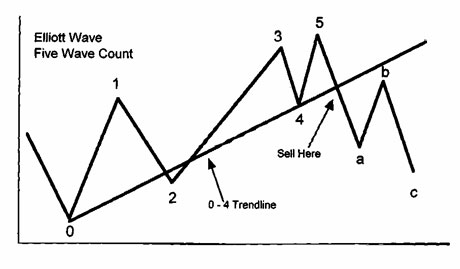
The Elliott Wave Principle was popular during the latter part of Andrews’ career and he was aware of this method. Andrews used trend lines to try and take advantage of the Elliott Wave pivot predictions. The Elliott Wave Theory teaches that market trends move in five waves. An example of an up trend moving up in five waves is seen in the diagram below. The price swings 1, 2, 3, 4, and 5 make up Elliott’s five-wave pattern. The Elliott wave pattern then teaches that a market correction will move in three waves in the opposite direction. In the diagram below the price swings labeled a, b, с are the three counter-trend swings. The same pattern also occurs in a downtrend with five waves down and three counter-trend waves.
Andrews taught that this pattern does not form in every trend but does occur frequently enough that traders should be aware of it. The strategy Andrews showed for trading this pattern is to draw 50 trend lines connecting pivots 0 and 4. In an uptrend, the price must fall below the 0 – 4 trend lines as the trend turns down after the wave 5 top. A trader sells when the price falls below the 0 – 4 trend lines. In a downtrend when the five wave pattern forms Andrews drew a downward 0-4 trend line. After the final wave 5 bottom, the price must progress above the 0 – 4 trend lines to form the upward a, b, с counter trend move. When the price breaks above the 0 – 4 trend lines, Andrews’ strategy maintains that this is a time to buy.
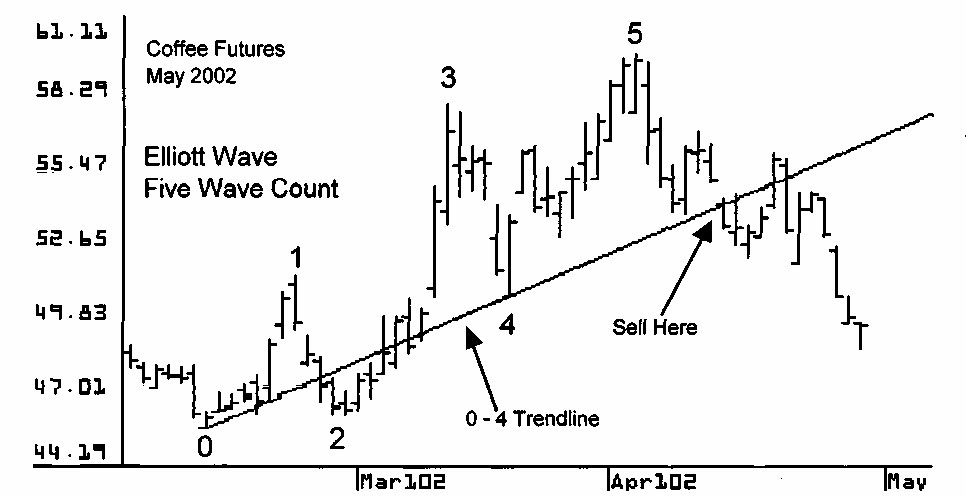
The top chart on this page shows May 2002 Coffee futures. This coffee contract makes a five-wave pattern upward. This pattern is labeled 0 to 5 and a trend line is drawn connecting pivots 0 and 4. When the price breaks below these 0 – 4 trend lines, a sell signal is given.
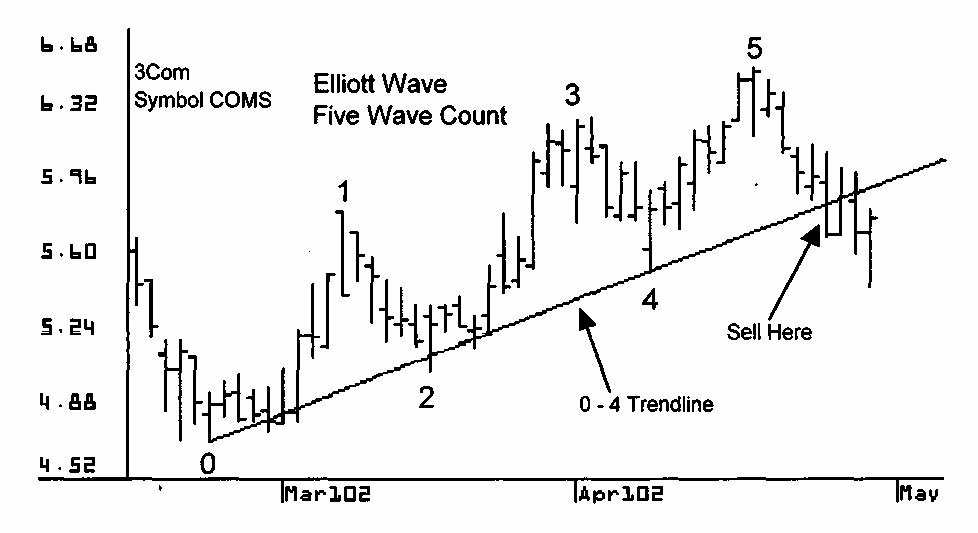
The chart below shows 3Com, symbol COM3. This stock makes a five wave pattern upward which is labeled 0 to 5. A trend line is drawn connecting pivots 0 and 4. When the price breaks below these 0 – 4 trend lines, a sell signal is triggered.
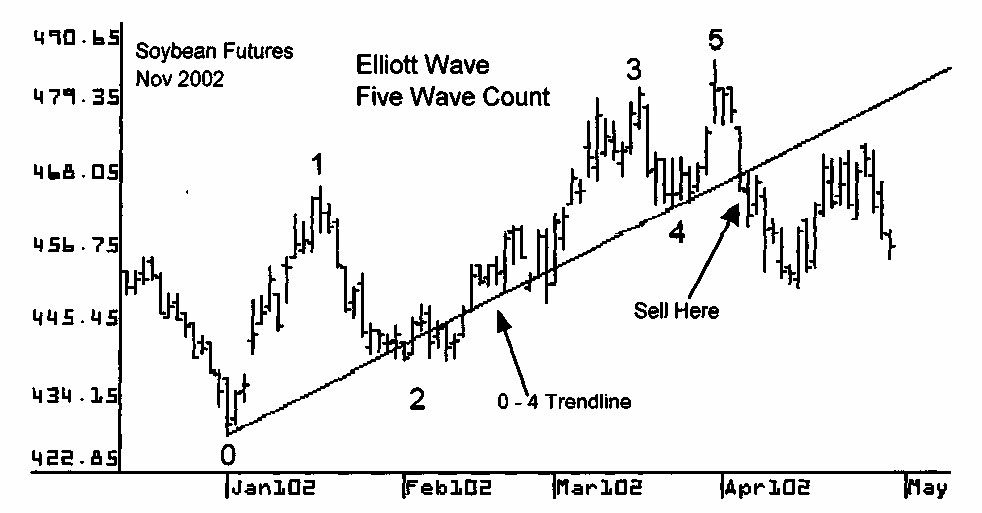
The top chart on this page shows November 2002 Soybean futures. This soybean contract makes a five-wave pattern upward. This pattern is labeled 0 to 5 and a trend line is drawn connecting pivots 0 and 4. When the price breaks below these 0 – 4 trend lines, it indicates the start of the a, b, с counter trend down move.
The chart below shows Double Click, symbol DCLK. This stock makes a five wave pattern upward which is labeled 0 to 5. A trend line is drawn connecting pivots 0 and 4. When the price breaks below these 0 – 4 trend lines, the start of a downward counter-trend move is indicated and it is time to sell.
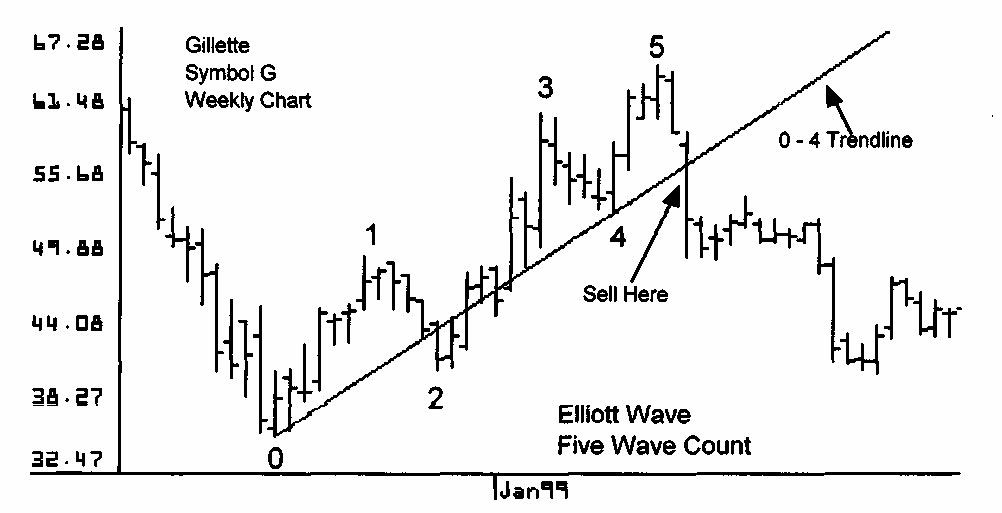
The top chart on this page is a weekly chart for Gillette, symbol G. This stock makes a five-wave pattern upward which is labeled 0 to 5. A trend line is drawn connecting pivots 0 and 4. When the price breaks below this 0 – 4 trend line, Andrews’ rules indicate a downward counter-trend move is underway.
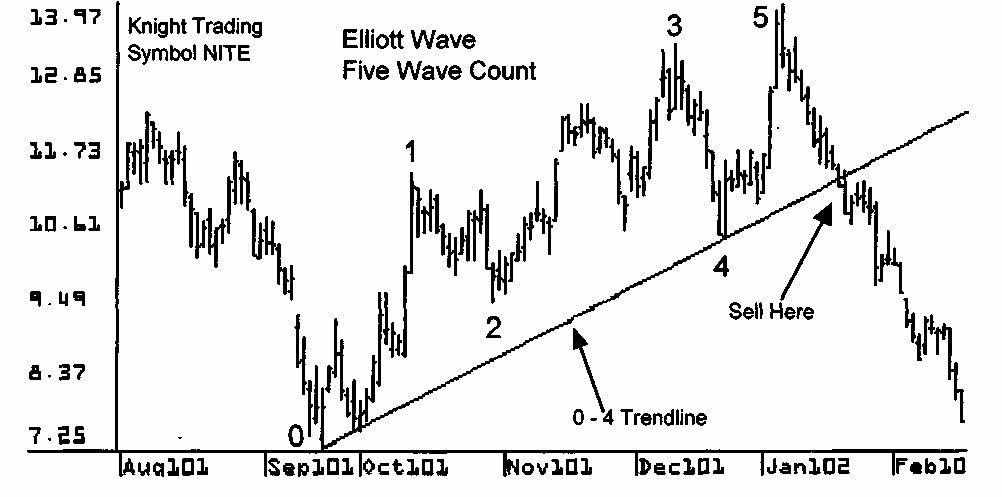
The chart below shows Knight Trading, symbol NITE. This stock makes a five wave pattern upward which is labeled 0 to 5. A trend line is drawn connecting pivots 0 and 4. When the price breaks below these 0-4 trend lines, a trader can sell the down move with confidence knowing the counter trend down move is underway.
Don’t forget to practice this great trading system only using our eyes, waves are the key to trading patterns
Become An Expert Elliott Wave Trader INSTANTLY
In The Next article, once again we study again about swing using Elliott wave patterns.
