Chaos Trading Strategy
The chaos theory is not a theory about disorder as some people think, but on the contrary – a theory about a different order or rather about a higher order that we are unaware of, if you are a fan of the Bill Williams trading methodology and if you are familiar with Elliott wave analysis, Five Dimensions expert system is the right choice for you and will be very helpful in your trading.
The “CHAOS” notion was first applied to the financial markets by a well-known American analyst and trader Ph.D. Bill Williams in his first book “Trading Chaos” was published in 1995.
The author calls “CHAOS” a new coming information, being in a way an energy, which using the feedback and further actions of the market players starts moving prices for financial and raw material assets upwards or downwards. CHAOS is freedom. It is a freedom of world perception, thinking, and motion. CHAOS is a patch of least effort, which the energy takes. TRADING CHAOS is a well-known trading strategy applied to stock market trading which is based on a non-linear movement.
Analysis of the graphical line of the price movement enables to revealing of certain patterns that later become trading signals for traders and analysts.
Get Limited E-Book For Secret Reading Of Candlestick Patterns Or Join Forex Managed Account Services
This website does not intend to repeat or describe the Chaos Theory in financial markets. The Internet has more than enough information about the Trading Chaos. Besides, it is much better to read the original source several times and complete training directly from the author of the strategy. My objective is to give a summary of the main postulates of the theory and of the trading signals of the strategy and then to present you my software related to this theory that generates every single trading signal, to teach to trade “CHAOS” using a specialized software.
In his Trading Chaos apart from the psychological aspects Bill Williams describes the following notions and trading signals:
1. “Safety Cushion” is a loss limit that a trader can afford not to destroy his trading account when the market is volatile. Safety cushion is placed one minimum deviation of the price above or below the highest high or the lowest low of the second bar (candle) to the back from the considered higher level taken from the period. For the day trading range, the higher level is considered to be a week, while for the 4-hour charts – a day, i.e. there must be a multiplicity equal approximately to five.
2. Bars. Candles. A rough estimate of the direction of the trend movement depending on in which third the last bar was closed. The description of the bullish and bearish extreme bars, the generation of which shows the possible change in the direction of the market movement. “Dive” and “climb” bars claim the trend-directed movement. Neutral bars confirm the formed directed market movement rather than its change.
3. Fractal is a diagrammatic price model consisting of a series of five consecutive bars, where the bar midpoint has either the highest or the lowest price compared to the two neighboring bars. The fractal with the highest high of the bar midpoint is called a buy fractal and the fractal with the lowest low of the midpoint of the price bar is called a sell fractal. Crossing the fractal level by regular price movement in one way or another indicates the generation of a directional impulse price movement that has a profit generation potential.
4. Fractal signal, fractal start, fractal stop (fractal stop-turn). Fractal signals may be of two types – buy signal and sell signal. If you view the chart from the right to the left, the fractal buy signal will be a fully formed fractal with the central bar position higher than the position of two neighboring bars to the left and the right, and if there is a fully formed fractal start further left from the fractal signal. The fractal sell signal, respectively, is a fractal with the central bar position lower than the positions of two neighboring bars to the left and to the right, and if there is a fully formed fractal start further to the left from the fractal signal. Signal fractal break brings us to the market in the direction of the break. The fractal start is the first signal placed on the chart further left from the fractal signal. If the price formed the fractal signal and then moved back to the fractal start, this cancels all trading signals and we should wait for the generation of the next fractal signal and place our pending order one minimum price deviation higher (lower) than the signal fractal level.
The fractal stop is the second fractal targeted in the opposite direction from the fractal start. Fractal stop-turn (stop) has the lowest (highest) position out of two fractals targeted in the opposite direction from the fractal signal.
5. Market wave movement. The distance between the opposite fractals is called a market wave. The wave theory provides for the price movement which graphically forms eight waves in the following order: the first wave is the impulse wave, the second is the correcting one, the third – is the impulse one, and the fourth, which is generally the longest wave, is the correcting one and is considered to be the most complicated out of all the waves, the fifth wave – the impulse one. Five waves are followed by three correcting waves А, B, and C. The wave А is targeted against the wave trend, the wave В corrects the wave А and is targeted at the general trend that formed the “five waves”. The third wave C moves in the direction opposite the main trend. Wave movement forms the trend cycles. The wave is the main market structure. The fractal is the main wave structure.
6. Market rhythm. The first mention of the indicators and their settings. Bill Williams suggested using three simple sliding middle lines on closure with the parameters 5, 13, 34 and MACD indicator with the parameters (5,34,5). The buy trading signal is formed if the flattened lines stand in the sequence 5>13>34 and the histogram of the MACD indicator grows. The sell signal МА 5<13
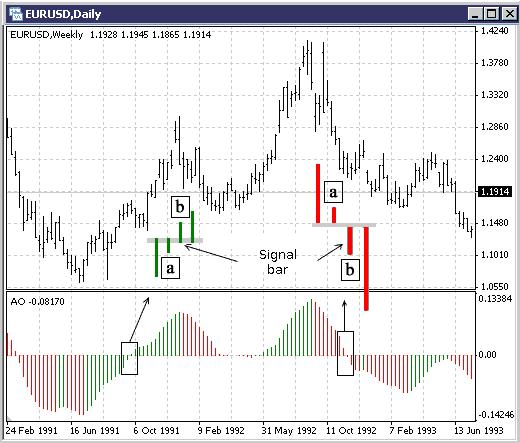
As computer software and special trading and analytical software improve, the Chaos Theory becomes even more developed in the financial markets. Bill Williams uses new computer possibilities in relatively stable markets. Based on the results of the research the author published his second book called “New Trading Dimensions”, which materially expanded the list of particular trading signals. The sliding middle lines described in the first book get new parameters and form a new indicator – ‘Alligator’. The market signals for entering the market at the fractal break are generated depending on their location against the Alligator’s mouth. The author introduces two new indicators АО (Awesome Oscillator) and АС (Accelerator Oscillator) into the traders’ use. He clearly describes the signals from these indicators. I will try to list those signals, but the description of them and the visualization may be viewed on the ‘indicators’ page of this website.
One of statement from Bill :
Conclusion
Five Dimensions system implements the proven trading experience from the well-known trading expert – Bill Williams, on some of the most advanced today trading platforms MetaTrader 4.0.
“Our first signal entry into any market is always the first fractal outside the Alligator’s mouth. Once this signal is hit, we will take all signals that are triggered in that direction.
If the buy signal is above the Red Balance Line (the Alligator’s Teeth), we would place a buy stop one tick above the high of the up fractal. If the sell signal is below the Red Balance Line, we would place a sell stop one tick below the low of the fractal sell signal.
We would not take a fractal sell signal if, at the time it is hit, the price is above the Red Balance Line. This is the best method we have found to filter out nonprofitable fractal trades.”
“Acceleration/Deceleration (AC) is the third dimension of our market analysis. Remember that
the price is the last item to change. Before the price changes, the momentum changes: and
before the momentum changes direction, there must be a deceleration of momentum until
momentum comes to zero. Then it starts accelerating in the opposite direction before the
price can change direction. That is what the AC measures, the Acceleration and Deceleration
of the current Momentum.”
© Bill Williams. “Trading Chaos”
Wait for the next part of Bill Williams Chaos Trading System Part 2


