Easy Profit With Trendline Forex Strategy
Okay, I’ll give again to you a simple system with no indicator that I have ever used. Why always a simple system ?…. because my brain was too heavy to think of complex systems … xixixi …. after all, a complex system does not always profit, is there a holy grail system?
Hi-Lo trendline projection … maybe you’ve never heard it. Yup … SRDC Advance, where to draw the line trendline from “Yesterday High / Low” to “High / Low” candle at “0:00” (GMT +1), then will be able to predict the movement of high/low today.
After I modified this strategy, I found the entry points are fairly accurate, I’ve got hundreds of pips in one day using this system … but again I say that no system is perfect ….
Rules Of Easy Trendline Trading Strategy
Step-by-step “Easy Profits with trendline 2” as follows:
1. Identify the “candle setup”. the candle “00:00” (GMT +1), this is my broker, please adjust your broker.
2. Draw a trendline from “Yesterday High” to “Candle Low Setup”. You can give a yellow color, this is the “Line Today Forecast Low”.
3. Draw a trendline from “Yesterday Low” to “High Candle Setup”. You can give a yellow color as well, this is the “Today Forecast High Line. ”
Note the picture below ….
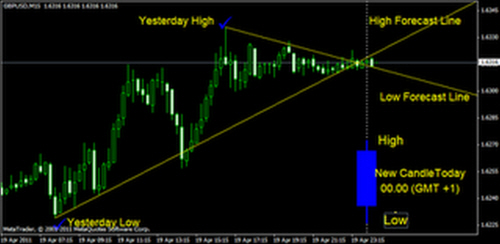
When prices trend up, then prices will move in the direction of “Line forecast high today. ” Conversely, when prices are trending down, then prices will move in the direction of “Line forecast low today. ”
4. Observe the movement of prices, and note and record the price reaction when it interacts with the yellow trendline that you have a picture of generally, the price will bounce when moving around the trendline.
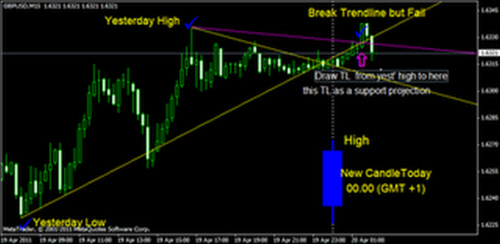
5. Mark when the price of trying to break the trendline, but failed to re-enter the area of the trendline.
6. For a Bullish scenario, if the price fails to break the “yellow upper trendline”, then draw the trendline with a different color (magenta), from “Yesterday High” to “Yellow trendline” who have failed to break the price.
The Magenta trend line is the trendline support, you will execute buy at this trendline, if the price is through this trendline, but turns again to the top.
7. For the Bearish scenario, if the price fails to break the “yellow lower trendline”, then draw the trendline with a different color (magenta), from “Yesterday Low” to the “Yellow trendline” who failed to break the price.
The Magenta trendline is resistant, you can open the “sell” on this trendline, if the price is through this trendline, but turned back down. Note the picture below:
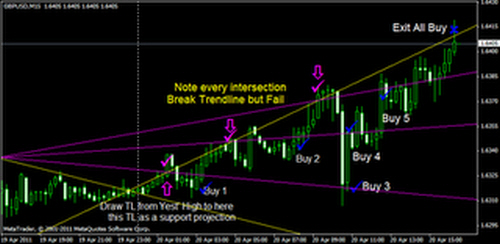
8. In the bullish scenario, you can exit the buy position, when the price touches the yellow upper trendline, as the upper limit price movement.
9. On the bearish scenario, you can exit sell positions, when the price touches the lower trendline yellow, as the lowest limit price movement.
10. Enjoy profit
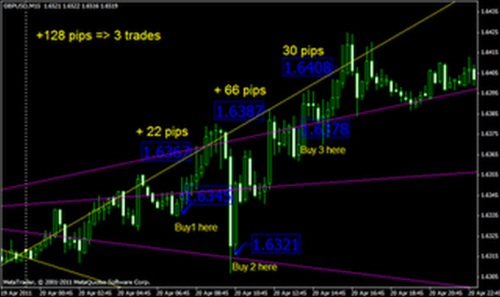
Need I remind you, that the example above is the ideal … you can get hundreds of pips in one pair for one day using this technique.
How to Predict Trendline Breakouts – Complete Trading Tutorial
But not all ideal conditions… I usually use the “EA’s profit lock” to keep the profits that have been collected.