Trendline Basic
Forex doesn’t have any time frame
At the beginning of trading forex, everyone will learn about how to use charts including Bar, line, and candlestick charts, so I probably have heard about time frames such as M15 M5 M1 H1 H4 D1 right? Then you will realize that Forex doesn’t have any time frame, since you want to trade with fast speed (full-time monitoring), use the fast chart, since you want to trade slowly (part-time monitoring), use a slower chart. So, the smallest time frame only helps traders to analyze in validation seller or buyer confirmation take a part or not by seeing the pin bar hammer as buyer power and inverted hammer pin bar as seller power, and of course, this pin bar location has to filter with basic trendline that we draw.

System Definition
The Flexible Trendline System is a popular forex trading strategy that utilizes trendlines to identify and trade with the trend. This strategy involves drawing trendlines on the price chart to identify the direction of the trend and then using them to enter and exit trades.
Here is a step-by-step guide to the Flexible Trendline System:
- Identify the trend: Start by identifying the overall trend in the market by drawing a trendline connecting the swing lows in an uptrend or swing highs in a downtrend.
- Enter trades: Look for opportunities to enter trades in the direction of the trend when the price retraces back to the trendline. This can be done using price action signals or other technical indicators to confirm the trade setup.
- Manage risk: Set stop-loss orders below the trendline in an uptrend or above the trendline in a downtrend to manage risk and protect your capital.
- Take profit: Consider taking profit when the price reaches the next significant level of support or resistance, or when the trendline is broken.
13 Trendline Trading tips and tricks you must know from one of the best forex traders on YouTube, you can check out the following video:
Watching video tutorials from experienced forex traders can provide valuable insights and practical examples of how to apply the Flexible Trendline System in real trading situations. Remember to always practice proper risk management and trade with caution when implementing any trading strategy.
What is the system based on?
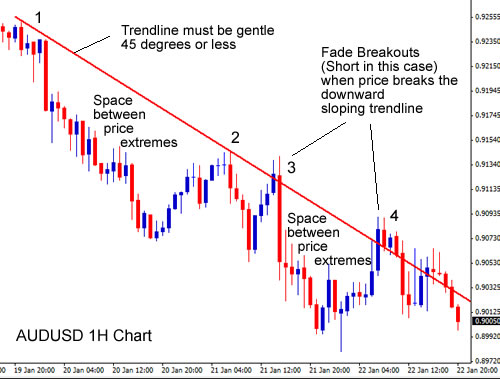
System based on Trend lines that can be modified, you may know that many traders draw 1 outer Trend-line with some inner Trend-line, and when the price breaks the outer Trend-line, they think the trend has been breakout, PA is going to change from UP/DOWN to DOWN/UP, is it right? It’s probably right, but still need a confirmation change of character on a lower time-frame-based price action of course. PA have random movements, they never go along 1 line! Your trend line can be breakout anytime, but the Trend Of Price ( TOS ) is not easy to break, price is not easy to turn from Down To Up! Please remember that, when your Trend-line was breakout, your price still can go down/up continuously! you will see more details about my system.
How to draw a Flexible Trend-line – How can we know if this flexible Trend-line is true or false?
Flexible Trend-line looks like same as others, but it needs some very IMPORTANT requirements to be done !!! (We will talk about uptrend at this task)
– If PA goes down and breaks the Support line, it means the Flexible trendline looks like same as others, but it needs some very IMPORTANT requirements to be done !!! (We will talk about uptrend at this task)
1 ) You need to find the Start Point (where the previous trend is broken ) to draw a Flexible trendline, if the start point is false, it means your flexible trendline won’t not true.
– Note: The Start Point ( The First Candle of Trendline ) will never be replaced until this trend finished
2 ) Draw a line connecting “Start Candle” with “Second candle”, then it’s your First Trendline. Draw a Horizontal Line at the Low of the second candle, then it’s SUPPORT now
3 ) every time you saw your trendline breakout, then the highest high now is RESISTANCE.
4) If PA can’t break the Support line, it turns back and breaks out the Resistance line, it means now Market decided to go straight ahead in the same direction, The Trendline should be modified now, draw line connects the low of the Start Point with the low of lowest candle (outside of previous trendline )
– If PA goes down and breaks the Support line, it means the trendline was broken, the trend has been changed ( not modified ) to DOWNtrend, find the start point of this downtrend, and start to draw again !!
All the steps above make too easy how to draw a Flexible trend line.
Let’s go ahead and talk about how to trade with the trend line now.
How to trade with Flexible Trendline
What time frame we should trade by using Flexible Trendline?
– Flexible trendline is easy to trade, but you need to look for the “Start Point” exactly, if the first candle of the trend is wrong, your risk is higher than you planned!
– The faster the chart (or smaller time frame), the more you can find the start point easier. So avoid trading on the Daily – Weekly – Monthly chart, just trade daily if you probably have a defined start point exactly – Say “NO” to the Weekly and Monthly charts.
Cases and Solutions for trading with Flexible Trendline
I) PA move within Safe Area ( Trendline hasn’t been broken yet)
*1) If you see PA is moving near Trendline, it means opportunities are opening … You have two cases to trade, here are they including their solutions
+ PA go near Trendline and place an order
+ If PA moves near the Trendline, then turn to the main direction of the trend, then Place SL at the Support line, and Place TP POINT based on previous movement and minimum Risk: Reward is 1:2.
+ If PA moves near the Trendline, then break the Trendline and go against your trade Keep your patience, don’t close your trade since PA hasn’t broken SUPPORT LINE, ok? please sit down and wait for the next movements, if PA goes to exactly the Support Line, then Open Another trade ( Double Risk same size) with tight SL from 10-15 Pips, then modify the SL of the previous trade to the same as the next trade. If SL was touched, then QUIT both of them Trend Changed Accept lost, wait for new trends that are establishing

Attention
Note: When PA moves near the Trend-line, it must be about 10-30 pip ( M5-M15-M30 ) or 40-60P ( H1 – H4 – D1) far from the Support Line, if it’s too far, then stay away from that trade. The closer the Support Line, the more Profits and Less Risk you have. So, exercise in how to draw a trendline with right or you can test a simple profitable trendline strategy for intraday traders by analyzing previous high low strategy using trendline and remember never to use trendline indicators better manually drawing our trendlines support resistance levels.


