Filtering Reversal Or Retracement
If you can easily distinguish between retracement or reversal then it is not impossible if you can make easy profits in your trading.
In a simple easily understood Reversal of Meaning = reversal (change of trend). While retracement means the temporary reversal or a temporary reversal. You could say a retracement that excessive means Reversal.
How Do I Identify A Retracement In Price Movement (chart)
The first way that is quite popular MetaTrader 4.0 tool is to use Fibonacci retracement, generally, a value or retracement area will range from 38.2% to 50.0% and 61.8% before the move to continue the overall trend.
If this level can range passes, most likely there will be a trend reversal.
For more details, let’s see the illustration image below:
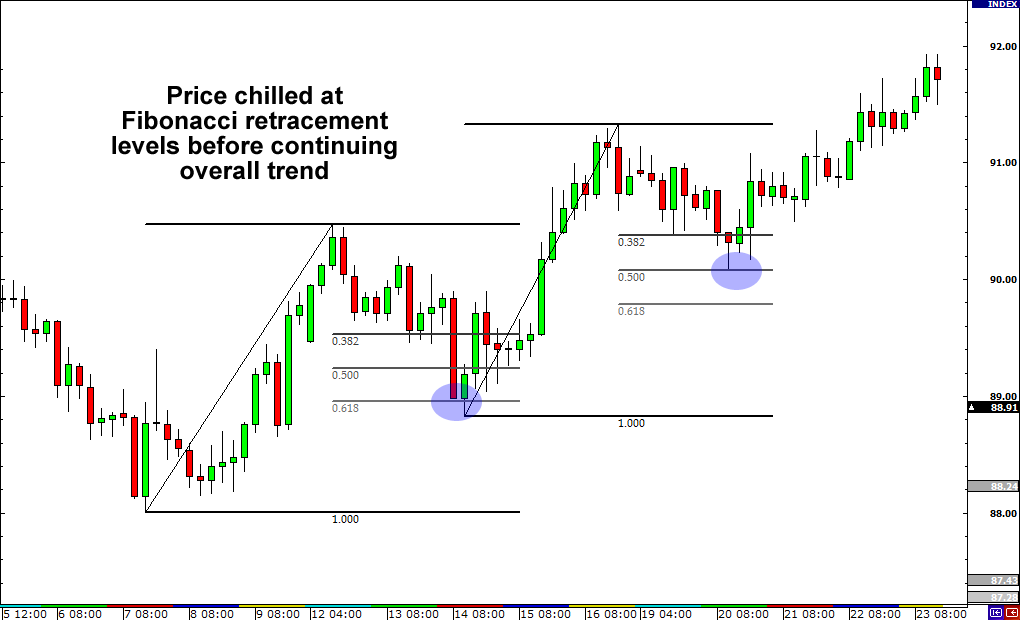
Areas with a picture of purple is a retracement level, at the first instance of the retracement occurs in the range of 68% Fibonacci level, and the second example in the range of 50% Fibonacci level. Also visible in the picture is that the retracement is a temporary trend reversal, to then follow the trend of parent / early (in the example image uptrend / Bullish).
Also Read Article :
The 2nd method, to identify a retracement is to use a pivot point analysis.
By using pivot points, the trader relies on the support and resistance calculations, where usually there are 6 levels/points which are calculated ie, S1, S2, S3 and R1, R2, R3. First support means S1, R1 means the first Resistance, and so on.
See the image below:
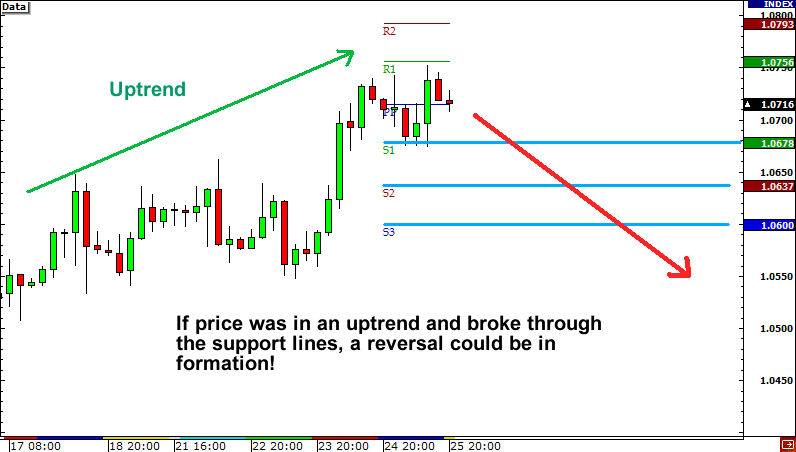
So if the trend of rising prices moves upward and bounces back after touching S1, then this is a retracement. But If the price continues to S2, S3 then it’s likely to happen reversal trend = Reversal.
The third way, using a line identifying the retracement trendline. The basic analysis is that if the trend line passes (break) then Reversal, if that means retracement bounces back.
Identify High-Quality And Valid Changes of Characters In The Forex Market
Best Pullback Trading Forex Strategies, Which Pullback Is The Best?
Best Forex Reversal Trading Strategy
There are 3 signs the market will make a reversal from a major trend. Steven shared about his strategy using C.E.S.T. See and learn how price actions forex trading technique and forex charts patterns strategy are still important in our analyses. C – Condition (Major Key Level Structure, RSI Convergence-Divergence, RSI Over Bought-Sold Chart Patterns, Candlesticks Pattern), E – Entry Based Condition, S – Stop Loss 1 time ATR from high last candle, T – Take Profit at a major key level at bigger timeframe
Conclusion:
* So a reversal pattern will we identify the first time as a retracement. But if this continues then the retracement that happened is a reversal. Practice reading about price action chart pattern setup in a small time frame like 15 minutes or 5 minutes to get the fastest entry signal from this reversal setup.
* Even with such methods as described above which show a retracement pattern/reversal, but still no reply to make sure of the end result when trading closed today. Experience and time in front of the PC to learn market movement still could not be replaceable which will make you more easily identify retracement or reversal.
* The following table will present comparisons between Reversal and retracement criteria, which may be easier for you to identify.
| Retracement | Reversal |
| Occurs when the trend is formed with a strong or after a strong price movement. | It could happen anytime. |
| Temporary (short term, bouncing) | Is Final |
| Is Technical. | Is fundamental. (there is news / real conditions/market affecting) |
One of the tips is to use strong support resistance on a daily time frame for filtering our trading decision and calculating our risk reward and don’t forget back to forex basics in reading depth market movement.
Also Read Article :
Don’t forget to try proven and tested swing forex trading strategy and channel forex trading strategy-based support resistance combined with overbought and oversold area-based high time frame.
You try in free demo forex account first to start this forex reversal strategy.

