Parabolic SAR Forex Indicator
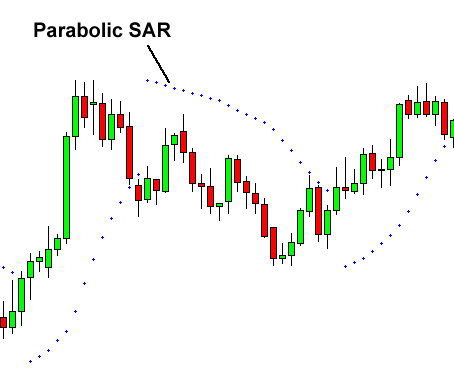
Parabolic SAR is a technical indicator developed by an analyst named Welles Wilder (Creator of the relative strength index). SAR is shown as a series of dots placed/located above or below the price.
A position above / below is used by traders to generate transaction signals depending on where the position of those points.
A dot placed under a price is considered a bullish signal.
Conversely, the points located above illustrate the price that bears are in control and that the momentum is likely to remain downward.
As we know many kinds of indicators in forex trading, which draw from the parabolic SAR are located on the ease of use (easily seen) from the above brief description by no means a simple look…
In addition, this indicator has another feature that is in the show during the reversal (end) of a trend.
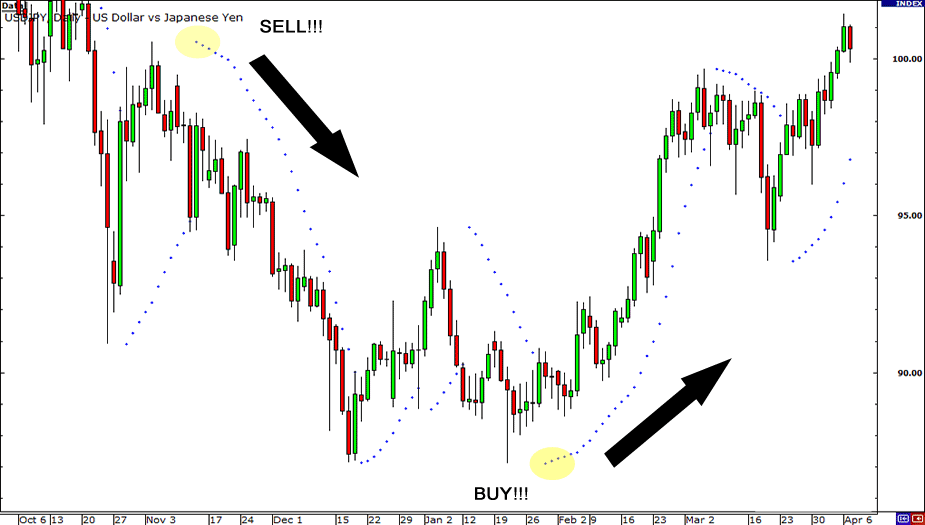
The picture below shows how parabolic SAR helps give the trend reversal signal. When a new point appears above the mean trend of the next is bearish (down), to be sure wait until form 3 points above.
Also Read Article :
And in the next example, a new point appears below the price, meaning the next trend is bullish (rising).
Another use of the PARABOLIC SAR is to show us, when should we have to get out of our current trade.
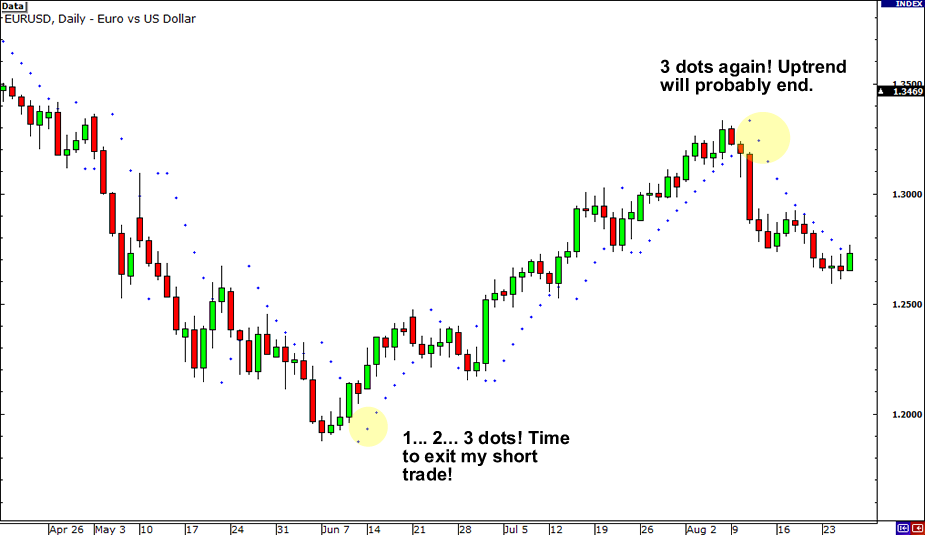
In the picture above, you bet If a sales position, then when the parabolic SAR leads to three new points below, we recommend that you immediately close to the position and record a gain, because there most likely will be a bullish trend, so that your profit potential is lost.
So if there are 3 new points of sale under the = trend is over, get ready for the trend to buy / bullish.
Also Read Article :
Currently, there are 3 points above = new purchasing trend ends, preparing sales trends / bearish.
Weaknesses Parabolic SAR
It can not be denied the SAR helps provide an easy point of view in determining the trend. However, the Parabolic SAR indicator is only accurate if a trend has already established a strong market.
Under conditions where the price moves dramatically (volatile / Chopper), parabolic sar becomes less effective. Second in market conditions where the trend is sideways (sideways), often creating SAR indicator (false signals) the wrong signal.
Conclusion:
* Parabolic SAR indicator is shown with a pattern of dots above and below the price.
* Point to the top = Trend Bearish / Sell / Down
* The point in the down position = Trend Bullish / Sell / Up
* 3 new points in the opposite position by now, can be regarded as an early signal of impending trend reversal
* parabolic SAR indicator effectively in a clear trend / strong or have been valid in the market, trending up or trending down.
* On the trend sideways / sideways, or when prices move very volatile, less effective SAR indicator and possibly raises false signals (false signals).
* As there is generally no perfect in an indicator, combined with other indicators to improve the balance is a good alternative and can be exercised.
Scalping and intraday trading strategies are highly recommended to get daily profits, one of the best forex scalping techniques is using the parabolic sar indicator which is very simple but effective in its accuracy. However, this parabolic sar indicator still needs to add several filters to get accurate signal strength, one of the additional filters is EMA 200 as the easiest trend detection filter. If the price is below the EMA 200 line, sell only and if the price is above the EMA 200 we buy only. Below is a video explanation.
Apart from the EMA 200 filter, we can also use other additional filters such as VOLUME, HEIKEN ASHI, BREAKOUT SUPPORT RESISTANCE, or LIQUIDITY ZONE STRATEGY and even FIBONACCI TRADING TECHNIQUES and must use additional filters PRICE ACTION and CANDLESTICK REVERSAL PATTERNS as support.
How to Identify and Trade High Probability POIs and Order Blocks- Smart Money Trading Strategies
Liquidity Concepts Simplified | SMC & Price Action
I highly recommend running in cents forex account at ROBOFOREX CENTS Account first to start this parabolic sar strategy and still needed to add some forex indicators confirmation or maybe adding some forex candlesticks reversal patterns strategy as a filter confirmation to get more strength forex signals.