Accurate Price Action Forex Signals
 As usual price action trading strategy still gets the top level in our analysis. Today I will share about this great trading system using price action 21 based on a four-hour time frame because this H4 time frame gives us high-accuracy trading signals to follow current major trends. We can look for the best signals in an hour time or 30-minutes or even a 15-minute time frame but still based on major trends from a four-hour time frame or daily better. This simple method-based price action is reading 3 candlestick. Why do we call this price action 21 ? is because 2 candlesticks are bull or bear and the third candle is in the opposite direction from the last 2 candles. These are the simple rules of this price action 21 trading concept.
Rules :
Buy forex signals
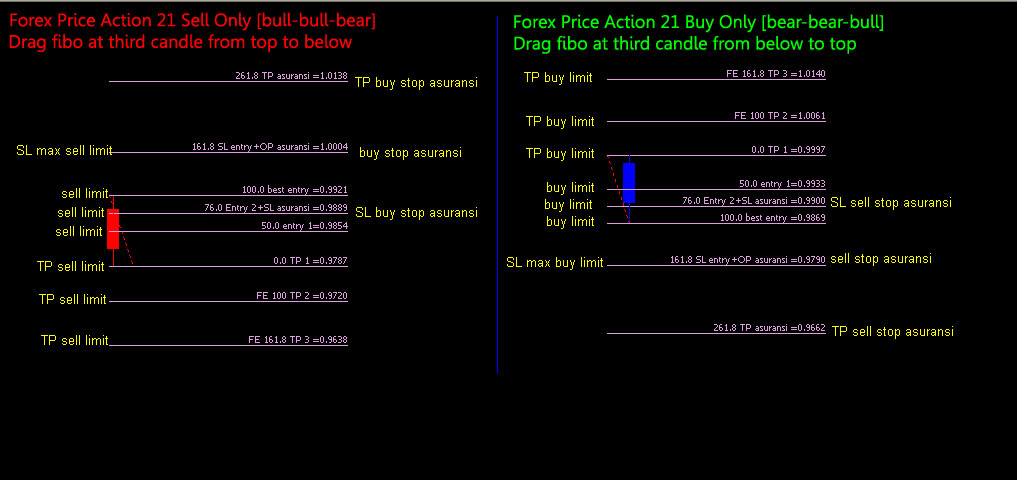
If there are two candles bearish and third candle is bullish and the closing price third candle is above from low price first candle. [Candle 1-2 bearish; Candle 3 bullish: Buy Only]
Sell forex signals
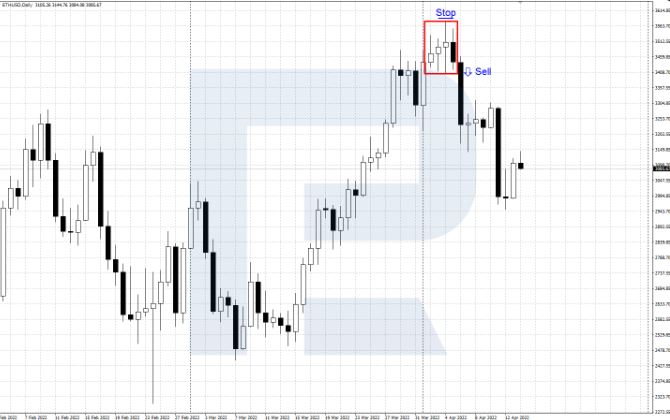
If there are two candle bullish and third candle is bearish and the closing price third candle is below from high price first candle. [Candle 1-2 bullish; Candle 3 bearish: Sell Only]
Forex Price Action Entry-Level
 With the price action 21 candle concept, we can enter with an instant order or use a pending limit order, depending on our trading style. But instant order is still the fastest way to get take profit at least first take profit level. And if you want to use pending limit orders we can use Fibonacci retracement as our tool for calculating the best level on entry and calculate take profit and stop loss itself. And remember to understand candlestick basics before using this strategy.
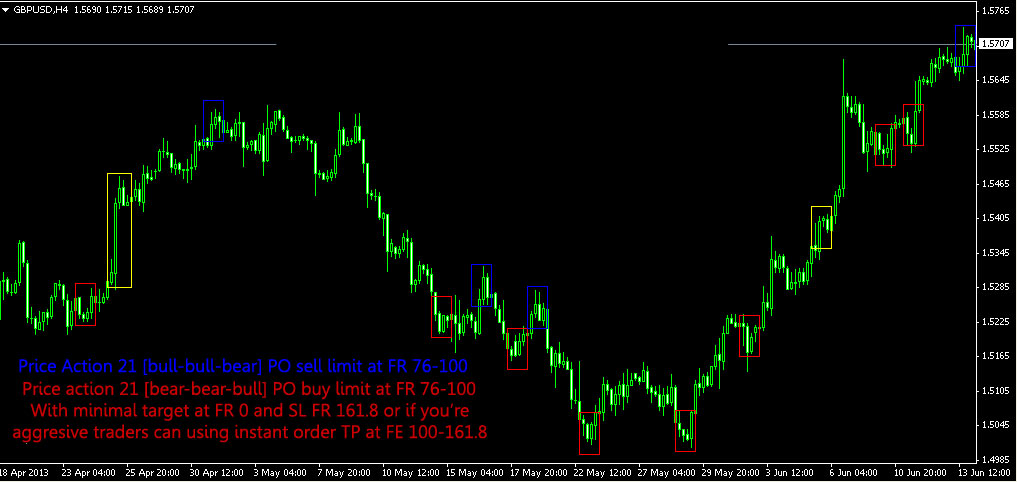
Drag Fibonacci retracement on the third candle on the bearish candle from top to below if we found sell signals and drag Fibonacci retracement on the third candle on the bullish candle from below to top if we found buy signals.
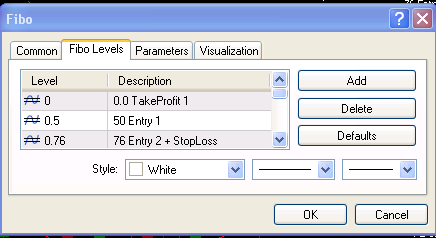
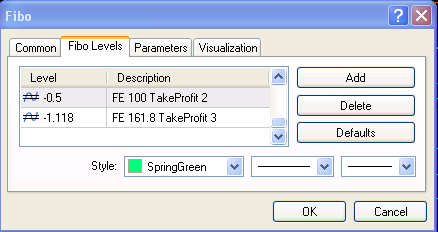
Usually, the best entry for limit pending orders located on the 76-100 level with target profit at least on FR 0 or at 100-161.8 Fibonacci expansion level and stop loss at FR 161.8 and for setting Fibonacci retracement just combined FR and FE become one so it’s made simple.
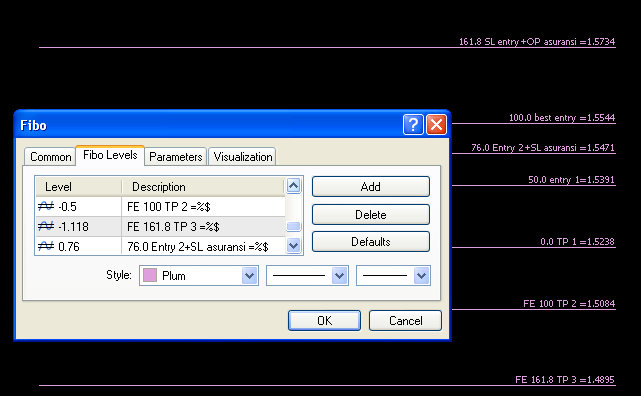
Here are details below about parameters from Fibonacci retracement :
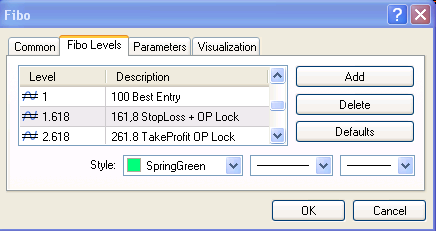
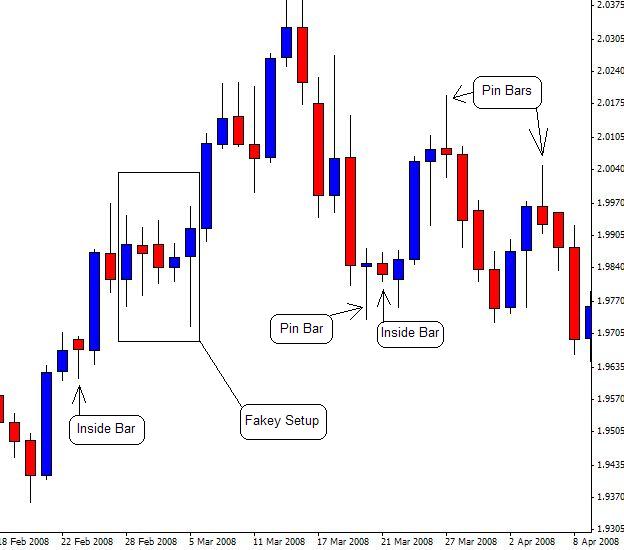
Some example chart entries using forex price action 21 :
This concept about price action 2-1 candle can implemented in scalping too lastly, I hope this article is about how getting accurate forex price action signals can be useful and bring us a good profit every day. Almost forget, learn, and understand too about price action trading strategy to minimize the risk in our trading journey. Here is the video tutorial of price action forex strategies that I recommend.
Candlestick Patterns To Master Forex Trading Price Action Strategy For Intraday Traders
The following is the basic price action method and is mandatory as a full-time trader. Market analysis based on price action combined with multi-time analysis is highly recommended to minimize the impact of losses and increase the level of accuracy of daily trading signals for intraday traders.

Candlestick patterns are an essential tool in forex trading, providing valuable insights into price action and potential market movements. Understanding and mastering these patterns can greatly enhance a trader’s ability to analyze and predict market trends. In this guide, we will explore some of the most important candlestick patterns used in forex trading, including double bottom, double top, three-line strikes, and bullish and bearish engulfing reversal patterns.
Importance of Candlestick Patterns
Candlestick patterns are visual representations of price movements and market sentiment. They provide valuable information about the balance between buyers and sellers, as well as potential trend reversals or continuations. By recognizing these patterns, traders can make more informed decisions about when to enter or exit trades.

Double Bottom and Double Top Patterns
A double bottom is suggestive of a change in direction and possibly the start of a new uptrend. In terms of profit targets, a conservative reading of the pattern suggests the minimum-move price target is equal to the distance between the two lows and the intermediate high. More aggressive targets are double the distance between the two lows and the intermediate high.
Double Bottom Pattern
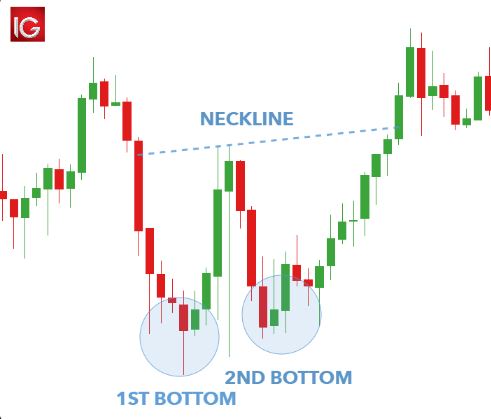
- Description: The double bottom pattern is a bullish reversal pattern that often signals the end of a downtrend. It consists of two consecutive troughs at roughly the same price level, followed by a price breakout above the intermediate peak between the two troughs.
- Significance: The pattern indicates a shift in market sentiment from bearish to bullish and presents an opportunity for traders to enter long positions.
- Application: Traders can use the double bottom pattern to identify potential buying opportunities as the price breaks above the intermediate peak, confirming a trend reversal.
How to Trade a Double Bottom Pattern
- Identify the pattern: Look for a double bottom pattern on your chart, which will look like the letter “W”.
- Wait for confirmation: The pattern becomes active once the price action breaks above the neckline.
- Set profit targets: Use the distance between the two lows and the intermediate highs as a guide for your profit targets.
- Monitor the market: Keep an eye on the market to ensure the trend reversal is confirmed and the uptrend is established.
Tips for Trading a Double Bottom Pattern
- Look for a clear and well-defined pattern.
- Be patient and wait for confirmation before entering a trade.
- Use stop-loss orders to protect your position.
- Consider using other technical indicators to confirm the pattern.
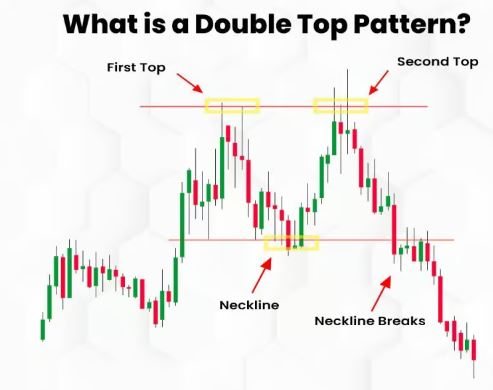
Double Top Pattern
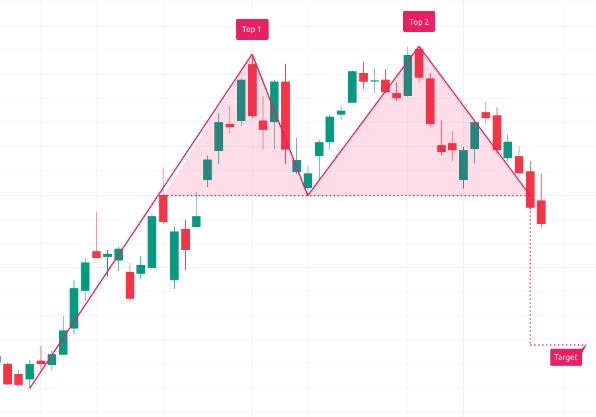
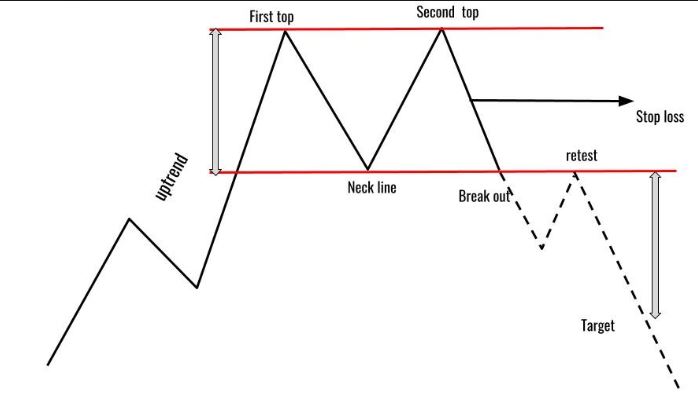
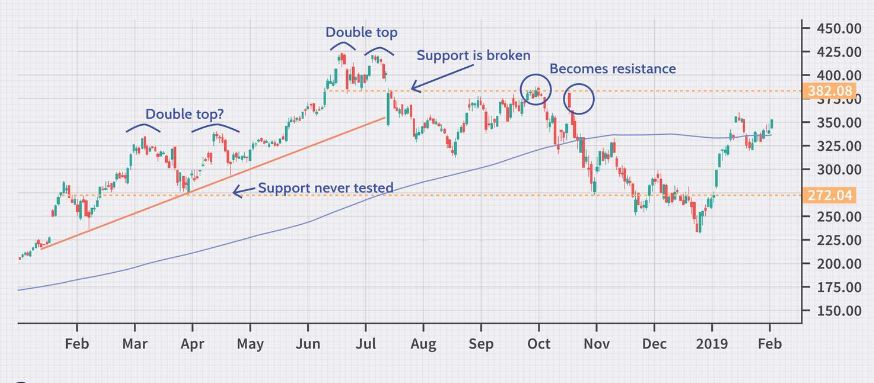
- Description: The double-top pattern is a bearish reversal pattern that signals the end of an uptrend. It consists of two consecutive peaks at approximately the same price level, followed by a price breakdown below the intervening trough.
- Significance: The pattern suggests a transition from bullish to bearish sentiment and allows traders to consider short positions.
- Application: Traders can use the double top pattern to anticipate potential selling opportunities as the price breaks below the intervening trough, confirming a trend reversal.
Failed double-top patterns occur when prices break through the resistance level after forming the second peak. Traders should be aware of these factors and adjust their strategies accordingly. One trading strategy for failed double tops is to place stop-loss orders above the resistance level, which allows traders to limit their losses while still potentially profiting from the downward trend.
To avoid these mistakes and increase the chances of success when trading double top patterns, traders should:
- Confirm the pattern by looking for a break in the neckline.
- Pay attention to the volume of the candlesticks during the formation of the pattern.
In conclusion, the double-bottom and double-tops pattern is a powerful reversal pattern that can be used to identify potential trend reversals and profit from them. By following the steps outlined above and using the tips provided, you can effectively trade a double-bottom or double-tops pattern and maximize your profits.
Three Line Strikes
- Description: The three-line strikes pattern consists of three consecutive long bullish or bearish candlesticks moving in the same direction. The fourth candlestick completely engulfs the three preceding candlesticks, indicating a strong reversal in sentiment.
- Significance: This pattern signals a significant shift in market sentiment and often leads to a rapid price movement in the opposite direction of the preceding trend.
- Application: Traders can use the three-line strikes pattern to identify potential trend reversals and consider entering positions in the direction of the new trend after the pattern completes.
Bullish and Bearish Engulfing Reversal Patterns
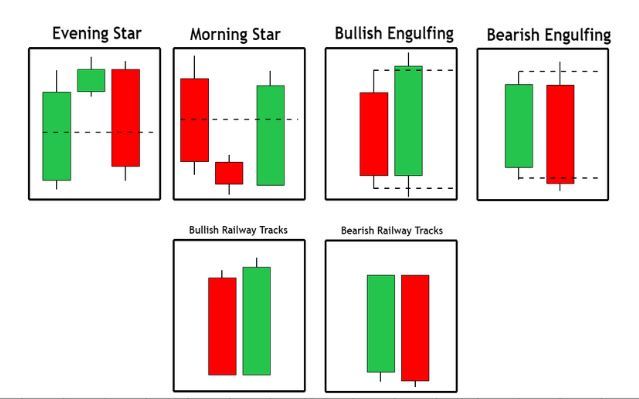
Bullish Engulfing Pattern
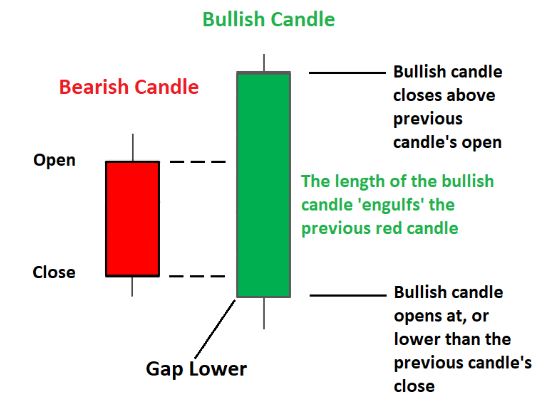
- Description: The bullish engulfing pattern occurs when a small bearish candlestick is followed by a larger bullish candlestick that completely engulfs the previous candlestick’s body.
- Significance: This pattern suggests a shift from bearish to bullish sentiment and can indicate a potential reversal of the preceding downtrend.
- Application: Traders can use the bullish engulfing pattern to identify potential buying opportunities as it signifies increased buying pressure and a possible trend reversal.
Bearish Engulfing Pattern
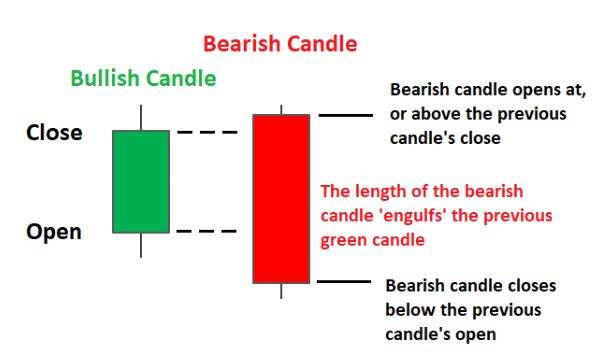
- Description: The bearish engulfing pattern occurs when a small bullish candlestick is followed by a larger bearish candlestick that completely engulfs the previous candlestick’s body.
- Significance: This pattern indicates a shift from bullish to bearish sentiment and can signal a potential reversal of the preceding uptrend.
- Application: Traders can use the bearish engulfing pattern to identify potential selling opportunities as it signifies increased selling pressure and a possible trend reversal.
Examples and Application in Real Trading Scenarios
Example Chart for Double Bottom Pattern
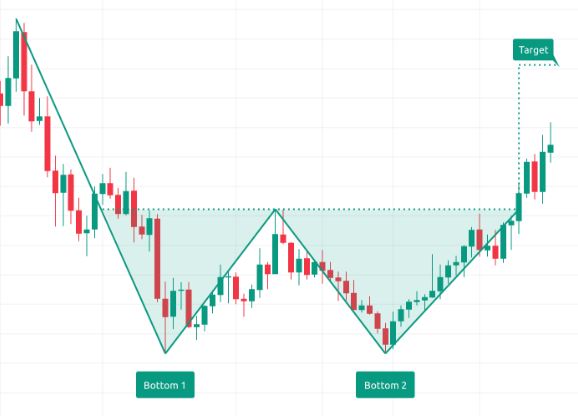
In this example, we can see a double bottom pattern forming as the price reaches two significant lows followed by a breakout above the intermediate peak, confirming the bullish reversal.
Example Chart for Bearish Engulfing Pattern
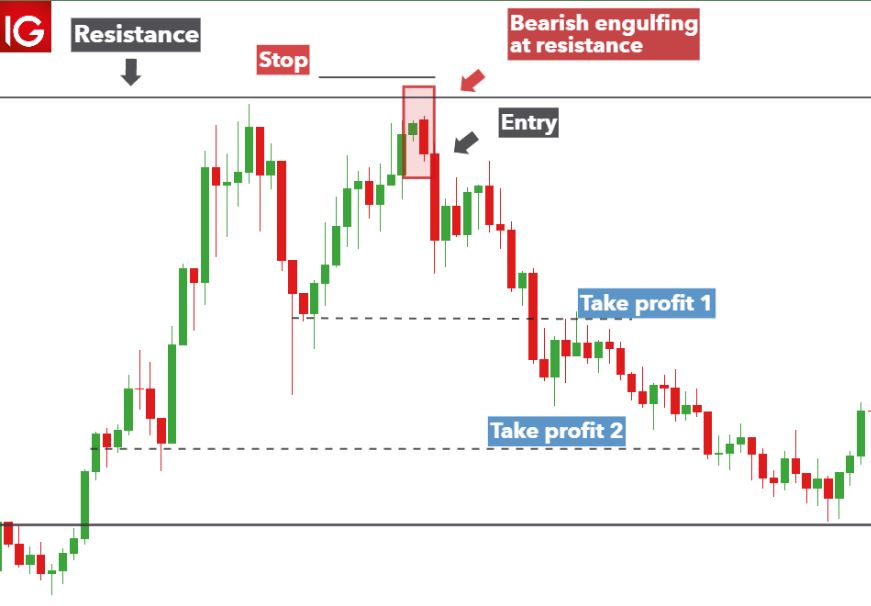
In this example, a bearish engulfing pattern is observed as a large bearish candle engulfs the previous small bullish candle, indicating a potential reversal of the uptrend.
By recognizing and understanding these candlestick patterns, traders can gain valuable insights into market sentiment and potential trend reversals, enabling them to make more informed trading decisions.
Conclusion
Candlestick patterns are powerful tools for analyzing price action and predicting market movements in forex trading. By mastering these patterns, traders can gain a competitive edge and improve their ability to identify potential entry and exit points in the market. Beginner to intermediate traders need to practice identifying and interpreting these patterns in real trading scenarios to enhance their trading skills and decision-making abilities.