Forex Trend Line Basics
Discover the forex trend line trading strategy that is guaranteed to revolutionize your trading game. In this article, we delve into the power of trend lines and how incorporating them into your trading strategy can lead to significant profits and life-changing results.
Using trend lines in forex trading allows you to identify and capitalize on market trends, ensuring you are always on the winning side of trades. Whether you are a beginner or an experienced trader, this strategy will give you a competitive edge by providing clear entry and exit points based on the established trend lines.
With this trend line trading strategy, you can say goodbye to guesswork and emotional trading. You will learn how to accurately identify trend reversal points and make informed trading decisions based on solid technical analysis.
Don’t let the complexities of forex trading intimidate you. Our step-by-step guide will break down the process in an easy-to-understand manner, empowering you to take control of your financial future. Get ready to transform your trading experience and achieve the financial success you’ve always dreamed of with this life-changing strategy.
Understanding Trend Lines in Forex Trading
Trend lines are one of the most powerful tools in forex trading. They represent the direction of the market, allowing you to identify whether it’s in an uptrend, downtrend, or moving sideways. By drawing trend lines on your forex charts, you can visualize the market’s behavior and make better trading decisions.
There are two main types of trend lines: uptrend lines and downtrend lines. An uptrend line connects a series of higher lows, indicating that the market is moving upwards. On the other hand, a downtrend line connects a series of lower highs, indicating that the market is moving downwards. By understanding these trend lines, you can determine the overall direction of the market and trade accordingly.
To draw trend lines, you need to identify at least two swing points on your chart. A swing point is a high or low point that the market has reached before reversing its direction. Once you have identified these points, you can draw a line that connects them. This line represents the trend and can be used to predict future price movements.
Using trend lines in forex trading is not just about drawing lines on your chart. It’s about understanding the psychology of the market and how it reacts to certain levels. Trend lines act as support and resistance levels, where buyers or sellers come into the market. By identifying these levels, you can anticipate potential reversals or breakouts and make profitable trades.
Types of Trend Lines and Their Significance
In forex trading, there are different types of trend lines that you need to be aware of, as they have different significances and implications for your trading strategy. Understanding these types will help you make better trading decisions and maximize your profits.
The first type is the main trend line, which represents the overall direction of the market. It’s drawn by connecting the major swing points on your chart and provides a clear picture of the market’s behavior. Trading in the direction of the main trend line increases your chances of success and reduces the risk of false signals.
The second type is the minor trend line, which represents smaller price movements within the main trend. These lines are drawn by connecting the minor swing points and can help you identify short-term trading opportunities. Trading with the minor trend line allows you to take advantage of temporary price fluctuations while still following the overall market direction.
The third type is the breakout trend line, which occurs when the price breaks through a trend line, indicating a potential trend reversal or continuation. Breakouts can be powerful trading signals, as they often lead to significant price movements. By identifying breakout trend lines, you can enter trades at the early stages of a new trend and maximize your profits.
Understanding the significance of each type of trend line is crucial for your trading success. By combining different types of trend lines, you can create a comprehensive trading strategy that takes into account both the long-term and short-term market trends.
Identifying Trend Lines on Forex Charts
Identifying trend lines on forex charts is a skill that every trader should master. By accurately drawing trend lines, you can gain valuable insights into the market’s behavior and make informed trading decisions.
To identify trend lines, start by looking for swing points on your chart. These are the high and low points that the market has reached before changing its direction. Once you have identified these points, connect them with a line, making sure it touches as many swing points as possible. The more swing points the line touches, the stronger the trend line becomes.
When drawing trend lines, it’s important to consider the timeframe you are trading on. Trend lines that are valid on a daily chart may not be as significant on a shorter timeframe, such as an hourly chart. Adjusting the timeframe allows you to identify trend lines that are relevant to your trading strategy and increase the accuracy of your trades.
It’s worth noting that trend lines are not always perfect. The market is dynamic, and price movements can deviate from the trend line temporarily. However, as long as the overall direction of the market remains intact, these deviations can be seen as opportunities to enter or exit trades.
Remember, practice makes perfect when it comes to identifying trend lines. The more you analyze charts and draw trend lines, the better you will become at spotting trends and making profitable trades.
Using Trend Lines to Determine Entry and Exit Points
One of the key advantages of using trend lines in forex trading is their ability to provide clear entry and exit points. By analyzing the market’s behavior in relation to the trend lines, you can identify optimal points to enter or exit trades, increasing your chances of success.
When using trend lines to determine entry points, look for price reversals near the trend line. A reversal occurs when the market changes its direction, either from an uptrend to a downtrend or vice versa. These reversals often happen at or near the trend line, making it an ideal entry point for your trades.
To confirm your entry point, you can use additional technical indicators or candlestick patterns. For example, if you see a bullish candlestick pattern forming near an uptrend line, it can be a strong signal to enter a long trade. Similarly, a bearish candlestick pattern near a downtrend line can signal a potential short trade.
When it comes to determining exit points, you can use the trend line as a trailing stop loss. As the market moves in your favor, you can adjust your stop loss level along the trend line, ensuring you lock in profits while still giving the trade room to breathe. This trailing-stop-loss approach allows you to maximize your profits during a trend while protecting yourself from sudden reversals.
It’s important to note that trend lines are not foolproof. Sometimes, the market can break through a trend line and continue its movement in the same direction. In such cases, it’s crucial to have a risk management strategy in place to protect your capital. By setting stop-loss orders and adhering to proper risk management principles, you can minimize losses and protect your trading account.
Common Mistakes to Avoid When Using Trend Lines
While trend lines can be a powerful tool in forex trading, there are common mistakes that traders make when using them. Being aware of these mistakes will help you avoid unnecessary losses and improve your trading performance.
One common mistake is drawing trend lines based on a limited number of swing points. Ideally, you should have at least two swing points to draw a trend line. However, the more swing points you have, the stronger and more reliable the trend line becomes. Drawing trend lines based on just one or two swing points can result in false signals and inaccurate predictions.
Another mistake is drawing trend lines that are too steep or too flat. Steep trend lines indicate a market that is moving too fast, while flat trend lines indicate a market that lacks momentum. Both scenarios can lead to false breakouts and whip-sawing trades. It’s important to draw trend lines that are neither too steep nor too flat, ensuring they accurately represent the market’s behavior.
Ignoring the timeframe is another common mistake when using trend lines. A trend line that is valid on a daily chart may not be as significant on a shorter timeframe, such as an hourly chart. Always adjust your trend lines based on the timeframe you are trading on, as this will increase the accuracy of your trades.
Lastly, emotional trading can undermine the effectiveness of trend lines. It’s important to stick to your trading strategy and not let fear or greed dictate your actions. Trend lines provide objective information about the market’s behavior, and it’s crucial to make trading decisions based on solid technical analysis rather than emotions.
By avoiding these common mistakes, you can enhance the effectiveness of trend lines in your trading strategy and increase your chances of success.
Advanced Techniques for Trend Line Trading
Once you have mastered the basics of trend line trading, you can take your skills to the next level with advanced techniques. These techniques allow you to extract even more value from trend lines and make better trading decisions.
One advanced technique is using multiple timeframes to confirm trend lines. By analyzing trends on different timeframes, you can get a clearer picture of the market’s behavior and increase the accuracy of your trades. For example, if you see a trend line breakout on a daily chart, confirming it on a lower timeframe, such as an hourly chart, can provide additional confidence in your trade.
Another advanced technique is using trend line channels. A trend line channel is formed by drawing parallel trend lines above and below the main trend line. These channels can act as dynamic support and resistance levels, providing additional trading opportunities. By trading within the channel, you can take advantage of price movements while still following the overall market trend.
Additionally, you can combine trend lines with other technical indicators to create a comprehensive trading strategy. For example, using trend lines in conjunction with moving averages or oscillators can provide additional confirmation for your trades. These indicators can help you filter out false signals and increase the accuracy of your entries and exits.
Remember, mastering advanced techniques requires practice and experience. Start by incorporating one advanced technique at a time into your trading strategy and monitor its effectiveness. Over time, you can refine your approach and develop a trading system that suits your trading style and goals.
Backtesting and Optimizing Your Trend Line Trading Strategy
To ensure the effectiveness of your trend line trading strategy, it’s important to backtest and optimize it. Backtesting involves applying your strategy to historical price data and analyzing the results. By backtesting, you can identify the strengths and weaknesses of your strategy and make necessary adjustments.
To backtest your trend line trading strategy, start by selecting a timeframe and a currency pair. Then, go back in time and analyze the price movements, drawing trend lines and making trading decisions based on your strategy. Keep a record of your trades and their outcomes, including entry and exit points, stop-loss levels, and profit targets.
Once you have completed the backtesting process, analyze the results and look for patterns or trends. Identify the successful trades and those that resulted in losses. This analysis will help you understand the performance of your strategy and identify areas for improvement.
Based on the findings from your backtesting, optimize your strategy by making necessary adjustments. This can include fine-tuning your entry and exit points, adjusting the stop-loss levels, or incorporating additional technical indicators. The goal is to refine your strategy and increase its profitability over time.
Remember, backtesting is not a guarantee of future success. The market is dynamic, and past performance does not guarantee future results. However, by backtesting and optimizing your strategy, you can increase its chances of success and gain confidence in your trading approach.
Trend Line Trading Indicators and Tools
To enhance your trend line trading strategy, there are several indicators and tools that you can use. These tools provide additional insights into the market’s behavior and help you make better trading decisions.
One popular indicator is the Moving Average Convergence Divergence (MACD). The MACD is a trend-following momentum indicator that helps you identify the strength and direction of a trend. By combining the MACD with trend lines, you can confirm trend reversals and filter out false signals.
Another useful tool is the Fibonacci retracement tool. The Fibonacci retracement levels are based on the Fibonacci sequence and can help you identify potential support and resistance levels. By combining these levels with trend lines, you can pinpoint areas where the market is likely to reverse or continue its movement.
Additionally, you can use oscillators, such as the Relative Strength Index (RSI) or the Stochastic Oscillator, to confirm trend line signals. Oscillators measure the overbought and oversold conditions of a market and can help you identify potential reversals. When an oscillator confirms a trend line signal, it provides additional confidence in your trading decision.
Lastly, there are several charting platforms and software that offer advanced trend line-drawing tools. These tools can automatically detect swing points and draw trend lines for you, saving time and reducing the chances of human error. Consider exploring these tools to streamline your trend line analysis and improve your trading efficiency.
Conclusion: Embracing the Power of Trend Lines in Forex Trading
In conclusion, the forex trend line trading strategy is a powerful tool that can revolutionize your trading game. By incorporating trend lines into your trading strategy, you can accurately identify market trends, determine entry and exit points, and make informed trading decisions.
Understanding the different types of trend lines and their significance is crucial for your trading success. By drawing trend lines based on swing points and adjusting them based on the timeframe, you can accurately represent the market’s behavior and increase the accuracy of your trades.
Avoiding common mistakes, such as drawing trend lines based on a limited number of swing points or disregarding the timeframe, is essential for effective trend line trading. By adhering to proper technical analysis principles and managing your emotions, you can improve the effectiveness of trend lines in your trading strategy.
Mastering advanced techniques, such as using multiple timeframes or trend line channels, allows you to extract even more value from trend lines and make better trading decisions. Additionally, backtesting and optimizing your trend line trading strategy helps you identify its strengths and weaknesses and refine it for better performance.
By incorporating trend line trading indicators and tools, such as the MACD or Fibonacci retracement, you can enhance your trend line analysis and increase the accuracy of your trades.
In conclusion, embracing the power of trend lines in forex trading can transform your trading experience and help you achieve the financial success you’ve always dreamed of. With the right knowledge, skills, and mindset, trend line trading can change your life. So, take the first step today and start incorporating trend lines into your trading strategy.
Easy Trendline Trading Strategy
The simple trading system that I share this time only for the execution relies on the trendline drawn manually, and 2 pieces of additional indicators as follows;
1. i-paramon worktime, is used to provide colored areas in the range of time “trading setup.”
2. Arrows are used to signpost the trend.
I use this system at TF 15 minutes and capture trading opportunities from “09:00” GMT until “12:00” GMT. You can customize it with time on your broker through the settings i-ParamontWorkTime indicator.
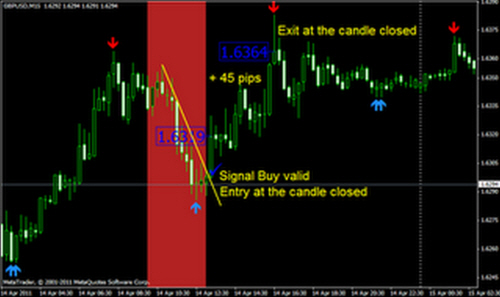
Take Position Buy if:
1. Note the colored area, note the high and low throughout this colorful area.
2. Up Arrow appears on the colored areas.
3. Fig trendline (/), starting from the high point (in the colored area) toward the high point of the last candle of the colored areas.
4. The candle crosses the trendline from the bottom up and make sure the candle closes above the trendline as a confirmation candle.
5. Take a buy position during the confirmation that the candle has been closed.
6. Let your profits run …. until the arrow is in opposite directions. You can close the buy position when the candle is closed.
Take the Sell Position if;
1. Note the colored area, note the high and low throughout this colorful area.
2. Down Arrow appears on the colored areas.
3. Fig trendline (/), starting from the low point (in the colored area) toward the low point of the last candle of the colored areas.
4. The candle crosses the trendline from top to bottom, and make sure the candle is closed below the trendline as a confirmation candle.
5. Take a sell position when the confirmation candle has been closed.
6. Let your profits run …. until the arrow is in opposite directions. You can close the sell position when the candle is closed.
Forex Trend Line Trading Strategy That Will Change Your Life
Best Trendline + Price Action trading secrets and trading strategies
You can use a trailing profit or profit lock to secure your profits…
Please download the indicators and the template here:
Easy Trendline Strategy