Double Pitchfork Analysis Techniques
We can analyze price movements based on technical limitations. Pitchfork trading strategy is based on identification of high or low reversal points. By linking the two reversal points and determine the middle point as reference to draw a median line parallel with the second channel is a reversal point.
By using the pitchfork analysis of this system we will obtain the limits of price movement in a technical.
As if you already know the channel or Gann Grid, pitchfork gave constraints like the support and resistant where the price will move to follow the channel, until finally break out and find new boundaries.
“BUY ZONE – SELL ZONE “
…. if it does exist … ;-)…
I am sure you also have to think about the “Buy Zone” – “Sell Zone”, a technical area where we will only put the “Buy Only” or “Sell Only”.
It is true that all depends on the time frame that is used …. for example, on a smaller time frame looks bullish trend, while at larger time frame looks to be only a correction of a bearish trend on a larger time frame. In the discussion this time, I used the time frame for H1 to determine the “Buy Zone” – “Sell Zone.”
Step-by-step analysis of double pitchfork :
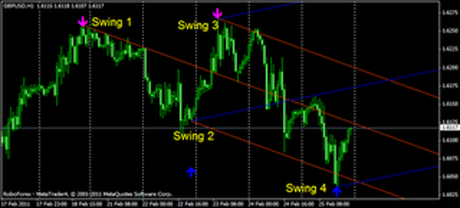
1. Mark the movement of “4 last swing.”
Up Trend = Swing Up – Swing Down – Swing Up.
Trend Down = Swing Down – Swing Up – Swing Down.
Swing Up is the lowest point where price turned to go up.
Swing Down is the highest point where price turned to go down.
To make it easier for you to get to this point, you can use the indicators Trend_Direction. This indicator will of give you an arrow up and down as a tool for analysis of top and bottom, not as an execution because it may change position (repaint).
2. Figure pitchfork red on the swing 1-2-3.
Select Insert -> Andrews pitchfork, click first on the swing point 1, the second click on the swing point 2, third click on point swing 3.
3. Image of blue pitchfork in swing 2-3-4.
Select Insert -> Andrews pitchfork, click first on the swing point 2, the second click on the swing point 3, the third click on point swing 4.
Take a look at this picture below :
Easy right?
4. Buy the zone is valid when the arrow appears as a signal swing 4 (Swing Up), the price of “cross up” one of the old channel line (red pitchfork). If this has not happened means swing 4 has not been valid, the price may still be a “new bottom” and the resulting arrow will shift (repaint). Because of that arrow is not used as an execution. You can use from your metatrader indicators RSI overbought / overshould 20-80 to add as a filter.
5. Sell valid zone, when when the arrow appears as a sign of Swing 4 (swing down), the price of “cross-down” one of the old channel line (red pitchfork). If this has not happened means swing 4 has not been valid, the price may still be a “new top” and cause the arrow will be shifted (repaint). Because of that arrow is not used as an execution parameter. You can use from your metatrader indicators RSI overbought / overshould 20-80 to add as a filter.
6. The execution of buy or sell performed, when the price of “cross trendline” from the old channel and the open price candle in the new channel.
In addition, as well as to facilitate determining the point of execution, you can use this indicators, which will appear aqua colored line breakout, so you can “buy” while flying in the buy zone. And will appear in magenta line breakout, so you can “sell” when you are on the sell zone.
7. Do not forget, “lock your profit ….” and “Let Your Profits Run ..”.
8. You can safely exit when price touches the upper channel.
9. If you want to maximize profits and take risks, you can hold some positions even though the price has penetrated the upper / lower channel, and the arrow opposite has emerged. As long as prices are still not back into the channel, then the arrow still more likely to shift (repaint).
You can actually exit when the arrow in opposite directions appear, prices will also cross the opposite direction on one line channel, you will create a new channel next.
You can delete old pitchfork (red), change the blue to red pitchfork, and gives a blue color to a new pitchfork when the final swing is valid.
I determine the “buy zone”, or “sell zone” if it meets two requirements. First, it has emerged arrows point reversal. Second, the price of re-break the previous channel pitchfork line.
If prices do not break the channel, then the possibility of a reversal point is still valid to say, or are still premature. That is still possible that prices will continue into the new top or bottom.
For example, sell zone declared valid if it appears the arrow points down and the price reversal break down the line channel, it could happen in the upper, middle or lower channel. While the projected price movement based on the new pitchfork drawn based on the new reversal that has a valid point …
So this double pitchfork method is one of my best system that I’ve used until now in my live trading.
You can download a brief explanation of the andrews pitchfork trading strategy here.
I highly recommend get free $30usd account with tickmill to start your forex journal in fbs censt with 1:000 laverage.


