One of the Good Non-Lagging Forex Indicators
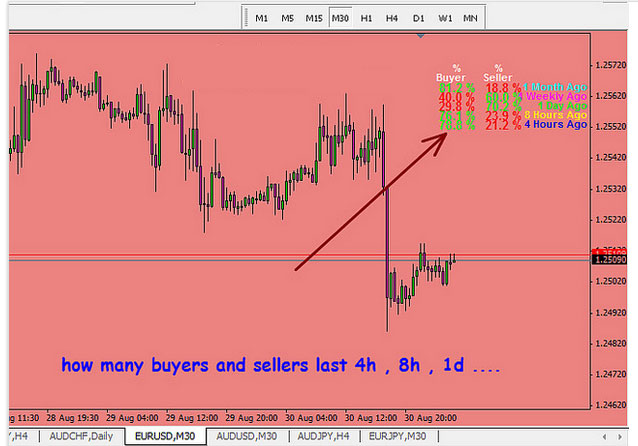
I’ve got a good indicator from the Forex forum, The name of this indicator is the buyer-seller strength indicator is sometimes very useful while the price runs on a support or resistance level. Just for adding our parameters in our analysis before we take action buying or selling.
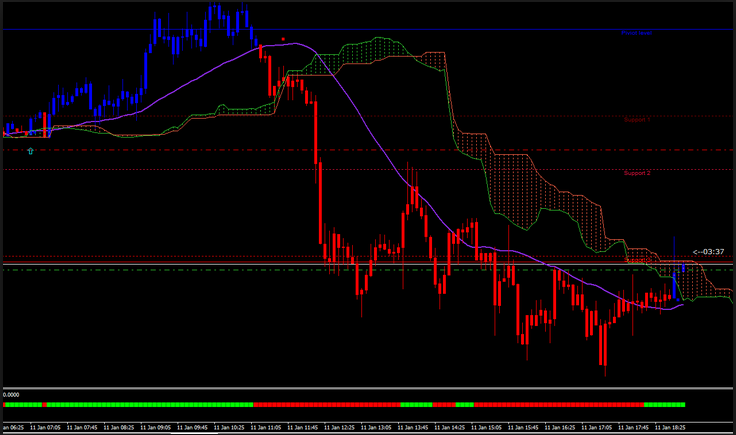
This indicator only helps us to determine how to minimize the risk so we at least can decide on the right side. In other ways, we have to understand first where a good zone for entry using this indicator. I mean we have to understand where a strong support resistance is. My suggestion read strong support resistance daily and look to the left at which level has broken after several tests, after we found a broken level zone that’s is a new strong support resistance is. It’s very simple, right? Or we can find the location of strong support resistance in a four-hour time frame too and combine it with candlestick reversal patterns.
Also Read Article :
Here example picture from the buyer’s seller strength indicators below :
Attention
 Lastly, be wise in using lot size because all variables analysis still needs to be our consideration. So, this buyer-seller strength indicator only gives us a little help to get our confidence in making our trading decisions. Don’t forget to download the best of the best no-repaint forex indicators or non-lagging forex indicators collection here, and don’t forget to read our easy and simple trading with Chaos Trading System by Bill Williams and easy pivot breakout trading strategy to explore our forex references.
Also Read Article :
High Probability Trading Zone Based Liquidity Zone Trading Strategy
Developing a trading strategy centered on identifying high-probability trading zones based on liquidity zones requires a comprehensive approach that integrates market analysis, risk management, and clear entry/exit points. The strategy aims to capitalize on areas of increased liquidity to maximize profitability while managing risk effectively.
- Identifying High Probability Trading Zones
- Utilize a liquidity zone strength indicator to identify areas of heightened buying or selling interest based on volume and price action.
- Analyze order flow data to pinpoint zones where significant buying or selling pressure is concentrated, indicating potential high-probability trading zones.
- Consider market depth to assess the presence of significant buy or sell orders at specific price levels, further validating the liquidity zones.
- Entry and Exit Points
- When a high probability trading zone is identified, look for price action confirmation such as rejections or absorption of orders at that level.
- Utilize technical analysis tools such as support and resistance levels, trend lines, or chart patterns to validate entry and exit points within the identified liquidity zones.
- Risk Management Techniques and Stop-Loss Strategies
- Implement a risk management strategy that includes setting stop-loss orders at a reasonable distance from entry points within the high-probability trading zones to limit potential losses.
- Consider incorporating position sizing based on the volatility of the financial market being traded to control risk exposure.
- Regularly reassess the risk-reward ratio for each trade and ensure that it aligns with your overall risk tolerance and trading objectives.
- Applicability Across Financial Markets
- The trading strategy can be applied to various financial markets such as stocks, forex, or commodities by adjusting the parameters of the liquidity zone indicators to suit the specific market dynamics.
- Consider adapting the strategy to different timeframes based on the volatility and liquidity characteristics of the targeted financial market.
Significance in Entry Points:
When identifying entry points within high-probability trading zones based on liquidity zones, various technical analysis tools can be valuable for confirming potential trade opportunities. Here are some specific technical analysis tools that can be used for entry points:
- Candlestick Patterns:
- Utilize candlestick patterns such as bullish/bearish engulfing, hammer, doji, and piercing patterns to identify potential reversal or continuation signals within the high-probability trading zones.
- Look for confirmation of these candlestick patterns at key levels of liquidity to validate entry points.
- The bullish engulfing pattern is a significant candlestick pattern in technical analysis that holds particular importance in identifying potential entry points in the market. Understanding the significance of a bullish engulfing pattern can provide valuable insights for traders seeking to capitalize on high-probability trading zones based on liquidity zones.
Bullish Engulfing Pattern:
- A bullish engulfing pattern occurs when a large bullish candle completely engulfs the prior smaller bearish candle.
- The bullish candle’s body fully engulfs the entire range of the previous bearish candle, indicating a shift in sentiment from bearish to bullish.
- Reversal Signal:
- The bullish engulfing pattern is widely regarded as a strong reversal signal when it appears at the end of a downtrend within a liquidity zone.
- It signifies a shift in momentum from bearish to bullish sentiment, potentially presenting an opportunity for traders to enter long positions.
- Confirmation of Buying Pressure:
- The pattern reflects a decisive shift in market sentiment, indicating that buyers have overwhelmed the sellers within the liquidity zone.
- This confirmation of buying pressure within a high-probability trading zone reinforces the attractiveness of the entry point for traders seeking to capitalize on potential upward price movements.
- Validation of Support Levels:
- When a bullish engulfing pattern forms near key support levels within the liquidity zone, it can serve as a validation of the support level and increase confidence in the entry point.
- Traders often interpret this pattern as a signal that the support level has held and that a potential reversal or bounce is likely.
- Volume Confirmation:
- Traders often look for a bullish engulfing pattern accompanied by a surge in volume, as it provides additional confirmation of the strength of the buying interest within the liquidity zone.
The significance of a bullish engulfing pattern in entry points lies in its ability to signal potential reversals, confirm buying pressure, validate support levels, and provide volume confirmation within high-probability trading zones based on liquidity zones. By recognizing and utilizing this pattern as part of a comprehensive trading strategy, traders can enhance their ability to identify favorable entry points and potentially capitalize on market movements with improved confidence and conviction.
- Support and Resistance Levels:
- Identify significant support and resistance levels within the liquidity zones using horizontal price levels, trend lines, or pivot points.
- Look for price reactions at these levels, such as bounces or breakouts, to determine entry points.
- Moving Averages:
- Use moving averages to identify the direction of the trend within the high-probability trading zones.
- Look for potential entry points when the price interacts with the moving averages, such as a bullish/bearish crossover or a pullback to the moving average.
- Volume Analysis:
- Analyze volume patterns within the liquidity zones to confirm entry points. Look for surges in volume that coincide with price movements to validate potential trade entries.
- Relative Strength Index (RSI) or Stochastic Oscillator:
- Use momentum oscillators like RSI or stochastic oscillators to identify overbought or oversold conditions within the liquidity zones, potentially signaling entry points for reversals or continuations.
- Fibonacci Retracement Levels:
- Apply Fibonacci retracement levels to identify potential entry points within the liquidity zones based on the retracement of a prior price move.
By incorporating these specific technical analysis tools into the trading strategy, traders can effectively confirm entry points within high-probability trading zones based on liquidity zones, thereby increasing the robustness and reliability of their trading decisions.
In summary, this trading strategy focuses on leveraging liquidity zone analysis to identify high-probability trading zones and implement well-defined entry and exit points while prioritizing risk management. It is designed to be adaptable across different financial markets and relies on sound logic supported by comprehensive market analysis and risk mitigation techniques. Always remember to thoroughly backtest the strategy and consider consulting with a financial professional before implementing it in live trading.
Never give up on learning and practicing even for scalping forex for intraday traders as long we can withdraw weekly for our family living cost at least. And trading forex with regulated forex brokers like ICMARKETS, HFM, FUSION MARKETS, EXNESS, and other very secure and regulated forex brokers on our right sidebar.