No Repaint Indicators For Intraday Scalping Forex Strategy for EURUSD Pairs
As forex traders, we know that timing is everything. That’s why understanding non-lagging forex indicators is so important when formulating a successful EURUSD trading strategy. These indicators help us make informed decisions by highlighting market trends in real-time, rather than relying on delayed data.
Non-logging forex indicators provide us with a continuous flow of up-to-date information, so we can effectively respond to changes in the market. These indicators calculate data based on the current price, making them more responsive and reliable than traditional lagging indicators.
By incorporating non-lagging forex indicators into our EURUSD trading strategy, we can effectively analyze market trends, identify entry and exit points, and minimize risk. These indicators provide valuable insights into market volatility, allowing us to make informed trading decisions.
Combined these best technical indicators have the potential profit gain 40-50 pips per trade entry on EURUSD pair. Now that you know how some of the most common chart indicators work, you’re ready to get down and dirty with some examples. Better yet, let’s combine some of these indicators and see how their trade signals pan out.
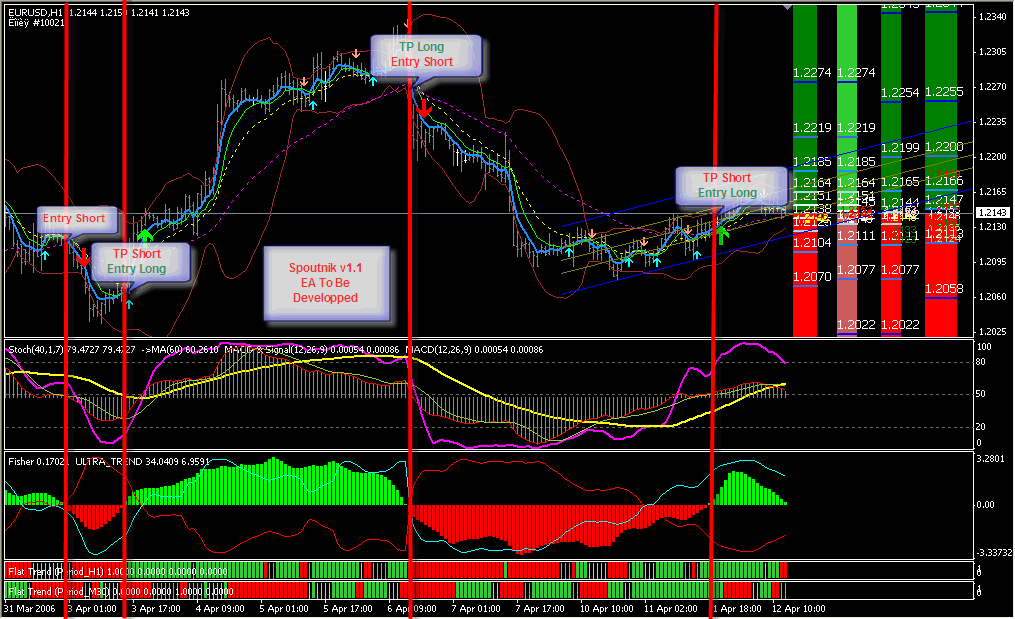
In a perfect world, we could take just one of these indicators and trade strictly by what that indicator told us. The problem is that we DON’T live in a perfect world, and each of these indicators has imperfections.
That is why many traders combine different indicators together so that they can “screen” each other. They might have 3 different indicators and they won’t trade unless all 3 indicators give them the same signal.
In this first example, we’ve got the Bollinger bands and the Stochastic on EUR/USD’s 4-hour chart. Since the market seems to be ranging or moving sideways, we’d better watch out for the Bollinger bounce.

Check out those sell signals from the Bollinger bands and the Stochastic. EUR/USD climbed until the top of the band, which usually acts as a resistance level.
At the same time, the Stochastic reached the overbought area, suggesting that the price could drop down soon.
And what happened next?
EUR/USD fell by around 300 pips and you would’ve made a hefty profit if you took that short trade.
Later on, the price made contact with the bottom of the band, which usually serves as a support level. This means that the pair could bounce up from there. With the Stochastic in the oversold area, it means we should go long.
If you took that trade, you would have gotten around 400 pips! Not bad!
Here’s another example, with the RSI and the MACD this time.
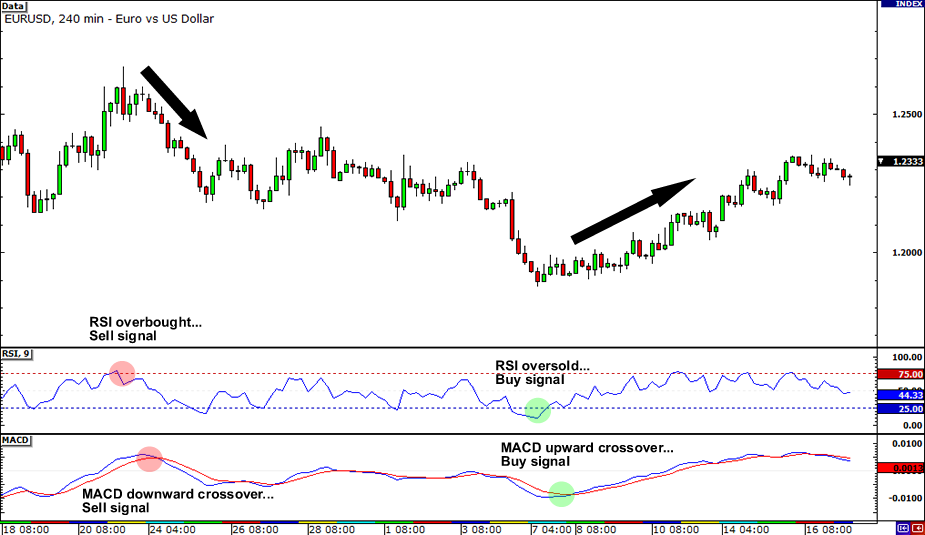
When the RSI reached the overbought area and gave a sell signal, the MACD soon followed with a downward crossover, which is also a sell signal. And, as you can see, the price did move downhill from there.
Hooray for our indicators!
 Later on, the RSI dipped to the oversold region and gave a buy signal. A few hours later, the MACD made an upward crossover, which is also a buy signal. From there, the price made a steady climb. More pips for us, fantastic!
You probably noticed in this example that the RSI gives signals ahead of the MACD. Because of the various properties and magic formulas for the technical indicators, some really do give early signals while others are a bit delayed.
You’ll learn more about this in sixth grade.
As you continue your journey as a trader, you will discover which forex indicators work best for you. We can tell you that we like using MACD, the Stochastic, and RSI.
One no-repaint indicator that’s effective in scalping strategies is the SuperTrend indicator. It works by identifying trends in the market and providing signals when those trends change direction. The SuperTrend indicator is also versatile, allowing you to adjust its settings to fit specific market conditions.
Another useful no-repaint indicator for EURUSD scalping strategies is the Ichimoku Kinko Hyo indicator. This indicator uses multiple lines on a chart to represent support and resistance levels, as well as trend direction and momentum. By analyzing these different elements, the indicator provides clear entry and exit signals for scalping trades.
The Ichimoku Kinko Hyo Indicator and price action trading principles can be used for intraday scalping trading strategy. The Ichimoku Kinko Hyo Indicator is a popular and flexible indicator that displays support and resistance, momentum, and trend direction. It is commonly used for middle-term and long-term timeframes, but it can still be used for intraday trading. The indicator consists of five lines: Tenkan-sen, Kijun-sen, Senkou Span A, Senkou Span B, and Chikou Span. Traders can use the upper and lower boundaries of the Ichimoku Cloud to identify potential entry and exit points for trades. Buy signals occur when a candlestick from below the Kumo cloud breaks and closes above the Leading, while sell signals occur when a candlestick from above the Kumo cloud breaks and closes below the Leading.
Price action trading principles can be used to complement the Ichimoku Kinko Hyo Indicator for intraday scalping trading strategy. Price action trading is a systematic trading strategy that uses recent price history and technical analysis tools to identify trade opportunities. It is based on the movement of price itself and allows traders to make their own decisions within a given scenario. Price action traders take trading positions according to their subjective analysis, behavioral assumptions, and psychological state. Price action trading rules create a framework and context for a trader’s actions to keep them safe.
How To Effectively Implement A Multi-Timeframe Pivot Breakout Trading Strategy?
The last no repaint indicator in trading forex analysis is Pivot Breakout on Multi TimeFrame Analysis.
Pivot points are significant levels used to determine potential support and resistance in the forex market. They are calculated based on the high, low, and closing prices of the previous trading session. Here are the steps to identify pivot points on multiple time frames:
- Calculate Pivot Points: Use the previous day’s high, low, and close to calculate the pivot point for the current trading day. The most common method is the five-point system, which involves calculating the pivot point (P) as the average of the high, low, and close prices from the previous trading day. Additionally, calculate the first and second levels of support (S1, S2) and resistance (R1, R2) using the pivot point.
- Determine the Time Frame: Pivot points can be calculated for various time frames, such as daily, weekly, and monthly. For intraday trading, the most common time frames are H1, H4, and Daily Time Frame. These time frame is like a bridge for major trends.
- Use Pivot Point Indicator: Consider using a pivot point indicator on your trading platform to automatically calculate and display pivot points for the selected time frame. This can help you visualize the pivot points and their corresponding support and resistance levels on your charts.
Conclusion
Every trader out there has tried to find the “magic combination” of forex indicators that will give them the right signals all the time, but the truth is that there is no such thing.
We urge you to study each indicator on its own until you know the tendencies of how it behaves relative to price movement, and then come up with a combination that you understand and that fits your trading style.
As we have seen throughout this article, incorporating non-lagging forex indicators and no repaint indicators can greatly enhance your EURUSD trading strategy. By using these powerful tools, you can make informed trading decisions and increase the profitability of your trades in the dynamic forex market.
Later on in the course, we will show you an example of a system that combines different indicators to give you an idea of how they can complement each other.
